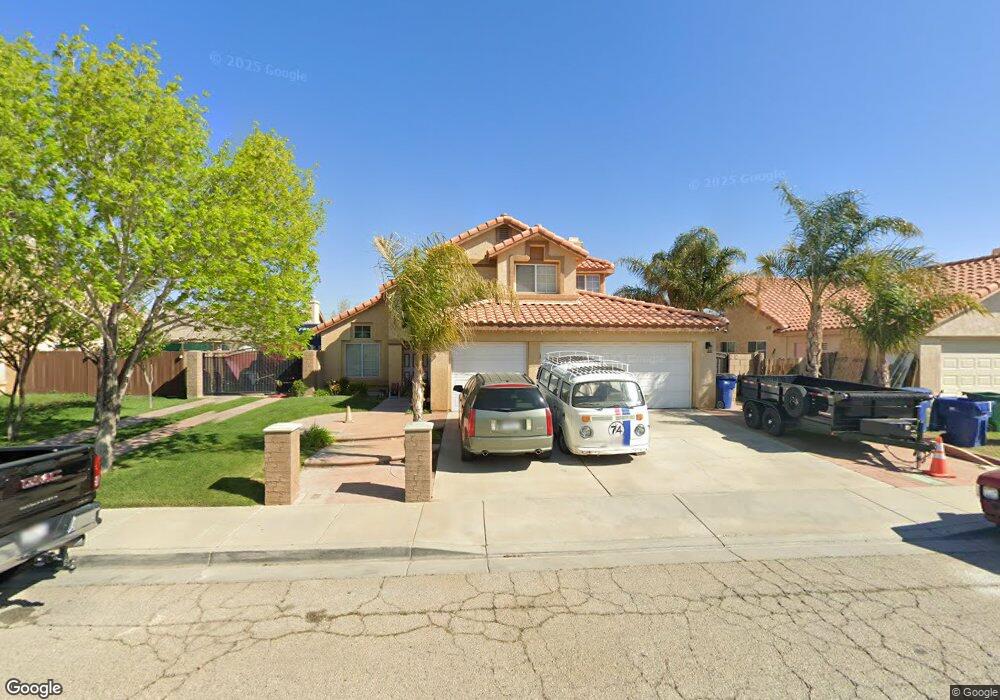
1813 E Milling St Lancaster, CA 93535
East Lancaster NeighborhoodEstimated Value: $452,000 - $546,000
3
Beds
3
Baths
2,094
Sq Ft
$231/Sq Ft
Est. Value
About This Home
This home is located at 1813 E Milling St, Lancaster, CA 93535 and is currently estimated at $482,921, approximately $230 per square foot. 1813 E Milling St is a home located in Los Angeles County with nearby schools including Joshua Elementary, Piute Middle School, and Eastside High School.
Ownership History
Date
Name
Owned For
Owner Type
Purchase Details
Closed on
Mar 30, 2018
Sold by
Aldaba Maria D
Bought by
Aldaba Maria D and Aldaba Brenda
Current Estimated Value
Purchase Details
Closed on
Nov 17, 2008
Sold by
Deutsche Bank National Trust Company
Bought by
Aldaba Basilio and Aldaba Maria D
Home Financials for this Owner
Home Financials are based on the most recent Mortgage that was taken out on this home.
Original Mortgage
$145,085
Outstanding Balance
$95,613
Interest Rate
6.16%
Mortgage Type
FHA
Estimated Equity
$387,308
Purchase Details
Closed on
Sep 12, 2008
Sold by
Turner Heather
Bought by
Deutsche Bank National Trust Co and Morgan Stanley Abs Capital I Inc Truts 2
Purchase Details
Closed on
May 4, 2006
Sold by
Pegs Mariko
Bought by
Pegs Charles D
Home Financials for this Owner
Home Financials are based on the most recent Mortgage that was taken out on this home.
Original Mortgage
$72,000
Interest Rate
6.46%
Mortgage Type
Stand Alone Second
Purchase Details
Closed on
May 3, 2006
Sold by
Pegs Charles D
Bought by
Turner Heather
Home Financials for this Owner
Home Financials are based on the most recent Mortgage that was taken out on this home.
Original Mortgage
$72,000
Interest Rate
6.46%
Mortgage Type
Stand Alone Second
Purchase Details
Closed on
Jun 4, 2003
Sold by
Foundation Iv Llc
Bought by
Pegs Charles D
Home Financials for this Owner
Home Financials are based on the most recent Mortgage that was taken out on this home.
Original Mortgage
$29,250
Interest Rate
5.53%
Mortgage Type
Purchase Money Mortgage
Purchase Details
Closed on
May 7, 2003
Sold by
Lewis James F
Bought by
Foundation Iv Llc
Home Financials for this Owner
Home Financials are based on the most recent Mortgage that was taken out on this home.
Original Mortgage
$29,250
Interest Rate
5.53%
Mortgage Type
Purchase Money Mortgage
Purchase Details
Closed on
Oct 18, 1998
Sold by
Lewis James F
Bought by
Lewis James F and Lewis Cherral A
Home Financials for this Owner
Home Financials are based on the most recent Mortgage that was taken out on this home.
Original Mortgage
$122,705
Interest Rate
6.6%
Mortgage Type
FHA
Purchase Details
Closed on
Jan 24, 1996
Sold by
Lewis James F
Bought by
Lewis James F and Lewis Cherral A
Purchase Details
Closed on
Nov 23, 1993
Sold by
Curtis Century Lancaster Company Ii
Bought by
Lewis James F
Home Financials for this Owner
Home Financials are based on the most recent Mortgage that was taken out on this home.
Original Mortgage
$129,471
Interest Rate
7.19%
Mortgage Type
FHA
Create a Home Valuation Report for This Property
The Home Valuation Report is an in-depth analysis detailing your home's value as well as a comparison with similar homes in the area
Home Values in the Area
Average Home Value in this Area
Purchase History
| Date | Buyer | Sale Price | Title Company |
|---|---|---|---|
| Aldaba Maria D | -- | None Available | |
| Aldaba Basilio | $147,000 | Chicago Title Company | |
| Deutsche Bank National Trust Co | $128,000 | Landsafe Title | |
| Pegs Charles D | -- | Chicago Title | |
| Turner Heather | $360,000 | Chicago Title | |
| Pegs Charles D | $195,000 | Chicago Title Co | |
| Foundation Iv Llc | $157,100 | -- | |
| Lewis James F | -- | Stewart Title | |
| Lewis James F | -- | -- | |
| Lewis James F | $130,000 | Lincoln Title Company |
Source: Public Records
Mortgage History
| Date | Status | Borrower | Loan Amount |
|---|---|---|---|
| Open | Aldaba Basilio | $145,085 | |
| Previous Owner | Pegs Charles D | $72,000 | |
| Previous Owner | Turner Heather | $288,000 | |
| Previous Owner | Pegs Charles D | $29,250 | |
| Previous Owner | Lewis James F | $122,705 | |
| Previous Owner | Lewis James F | $129,471 | |
| Closed | Pegs Charles D | $156,000 |
Source: Public Records
Tax History
| Year | Tax Paid | Tax Assessment Tax Assessment Total Assessment is a certain percentage of the fair market value that is determined by local assessors to be the total taxable value of land and additions on the property. | Land | Improvement |
|---|---|---|---|---|
| 2025 | $3,655 | $189,287 | $37,852 | $151,435 |
| 2024 | $3,655 | $185,576 | $37,110 | $148,466 |
| 2023 | $3,580 | $181,938 | $36,383 | $145,555 |
| 2022 | $3,385 | $178,371 | $35,670 | $142,701 |
| 2021 | $2,992 | $174,874 | $34,971 | $139,903 |
| 2019 | $2,910 | $169,689 | $33,935 | $135,754 |
| 2018 | $2,859 | $166,363 | $33,270 | $133,093 |
| 2016 | $2,706 | $159,905 | $31,979 | $127,926 |
| 2015 | $2,674 | $157,504 | $31,499 | $126,005 |
| 2014 | $2,663 | $154,419 | $30,882 | $123,537 |
Source: Public Records
Map
Nearby Homes
- 1814 E Milling St
- 0 E Nugent St
- 1733 E Norberry St
- 2113 E Donatello St
- 44640 Driftwood St
- 2036 E Jenner St
- 0 Cor 17th Ste Ketteing St Unit 25000899
- 2009 E Jenner St
- 1639 E Kettering St
- 2108 Beechwood St
- 44544 15th St E Unit 9
- 45064 18th St E
- 47700 17th St E
- 2125 E Jackman St
- 44827 Rock Island Dr
- 44460 15th St E Unit 13
- 44508 15th St E Unit 12
- 2310 Lightcap St
- 1609 Silvia Ave
- 44840 Fenhold St
- 1821 E Milling St
- 1807 E Milling St
- 1816 E Lingard St
- 1810 E Lingard St
- 1824 E Lingard St
- 1801 E Milling St
- 1822 E Milling St
- 1808 E Milling St
- 1832 E Lingard St
- 1802 E Lingard St
- 1830 E Milling St
- 1837 E Milling St
- 1840 E Lingard St
- 1817 E Lingard St
- 1817 E Newgrove St
- 1811 E Lingard St
- 1825 E Newgrove St
- 1811 E Newgrove St
- 1825 E Lingard St
- 1838 E Milling St
Your Personal Tour Guide
Ask me questions while you tour the home.