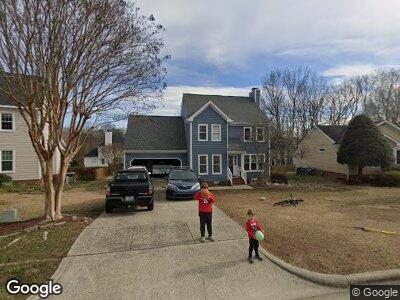
1813 Keokuk Ct Apex, NC 27523
West Cary NeighborhoodEstimated Value: $536,000 - $582,000
3
Beds
3
Baths
1,924
Sq Ft
$293/Sq Ft
Est. Value
About This Home
This home is located at 1813 Keokuk Ct, Apex, NC 27523 and is currently estimated at $564,258, approximately $293 per square foot. 1813 Keokuk Ct is a home located in Wake County with nearby schools including Salem Elementary, Salem Middle, and Green Hope High.
Ownership History
Date
Name
Owned For
Owner Type
Purchase Details
Closed on
Jul 21, 2017
Sold by
Zabriskie Linda and Zabriskie Steven
Bought by
Emory Brad A and Emory Brooks B
Current Estimated Value
Home Financials for this Owner
Home Financials are based on the most recent Mortgage that was taken out on this home.
Original Mortgage
$212,100
Interest Rate
3.9%
Mortgage Type
New Conventional
Purchase Details
Closed on
Jun 6, 2014
Sold by
Zabriskie Linda and Marasco Linda C
Bought by
Zabriskie Linda and Zabriskie Steven
Purchase Details
Closed on
Feb 19, 2014
Sold by
Bills Clifford and Bills Margo
Bought by
Marasco Linda C and Zabriskie Steven
Home Financials for this Owner
Home Financials are based on the most recent Mortgage that was taken out on this home.
Original Mortgage
$229,500
Interest Rate
4.55%
Mortgage Type
New Conventional
Create a Home Valuation Report for This Property
The Home Valuation Report is an in-depth analysis detailing your home's value as well as a comparison with similar homes in the area
Home Values in the Area
Average Home Value in this Area
Purchase History
| Date | Buyer | Sale Price | Title Company |
|---|---|---|---|
| Emory Brad A | $303,000 | None Available | |
| Zabriskie Linda | -- | None Available | |
| Marasco Linda C | $510,000 | None Available |
Source: Public Records
Mortgage History
| Date | Status | Borrower | Loan Amount |
|---|---|---|---|
| Open | Emory Brad A | $202,600 | |
| Closed | Emory Brad A | $40,000 | |
| Closed | Emory Brad A | $212,100 | |
| Previous Owner | Marasco Linda C | $229,500 | |
| Previous Owner | Bills Clifford | $64,000 | |
| Previous Owner | Bills Clifford A | $104,000 | |
| Previous Owner | Bills Clifford | $32,000 | |
| Previous Owner | Bills Clifford A | $134,000 | |
| Previous Owner | Bills Clifford A | $135,000 | |
| Previous Owner | Bills Clifford A | $12,600 | |
| Previous Owner | Bills Clifford A | $144,400 |
Source: Public Records
Tax History Compared to Growth
Tax History
| Year | Tax Paid | Tax Assessment Tax Assessment Total Assessment is a certain percentage of the fair market value that is determined by local assessors to be the total taxable value of land and additions on the property. | Land | Improvement |
|---|---|---|---|---|
| 2024 | $4,590 | $535,404 | $200,000 | $335,404 |
| 2023 | $3,861 | $350,123 | $120,000 | $230,123 |
| 2022 | $3,625 | $350,123 | $120,000 | $230,123 |
| 2021 | $3,486 | $350,123 | $120,000 | $230,123 |
| 2020 | $3,451 | $350,123 | $120,000 | $230,123 |
| 2019 | $2,903 | $253,885 | $84,000 | $169,885 |
| 2018 | $2,735 | $253,885 | $84,000 | $169,885 |
| 2017 | $2,546 | $253,885 | $84,000 | $169,885 |
| 2016 | $2,509 | $253,885 | $84,000 | $169,885 |
| 2015 | $2,325 | $229,492 | $74,000 | $155,492 |
| 2014 | $2,241 | $229,492 | $74,000 | $155,492 |
Source: Public Records
Map
Nearby Homes
- 2006 Keokuk Ct
- 1665 Wilde Bend
- 1911 Housatonic Ct
- 2412 Castleburg Dr
- 802 Wakehurst Dr
- 117 Whitehaven Ln
- 2200 Wild Apple Ct
- 745 Orange Oak Ln
- 6824 Wood Forest Dr
- 705 Blue Pointe Path
- 421 Raven Cliff St
- 6716 Valley Woods Ln
- 2208 Walden Creek Dr
- 100 Wentbridge Rd
- 524 Rowanwood Way
- 2317 Colony Woods Dr
- 2015 White Pond Ct
- 216 Billingrath Turn Ln
- 213 Billingrath Turn Ln
- 1305 Holt Rd
- 1813 Keokuk Ct
- 1815 Keokuk Ct
- 1811 Keokuk Ct
- 1911 Castleburg Dr
- 1913 Castleburg Dr
- 1901 Keokuk Ct
- 1909 Castleburg Dr
- 1809 Keokuk Ct
- 1810 Keokuk Ct
- 1915 Castleburg Dr
- 1907 Castleburg Dr
- 1903 Keokuk Ct
- 1807 Keokuk Ct
- 2001 Ironsides Ln
- 1902 Keokuk Ct
- 1806 Keokuk Ct
- 1917 Castleburg Dr
- 1905 Castleburg Dr
- 1905 Keokuk Ct
- 1805 Keokuk Ct