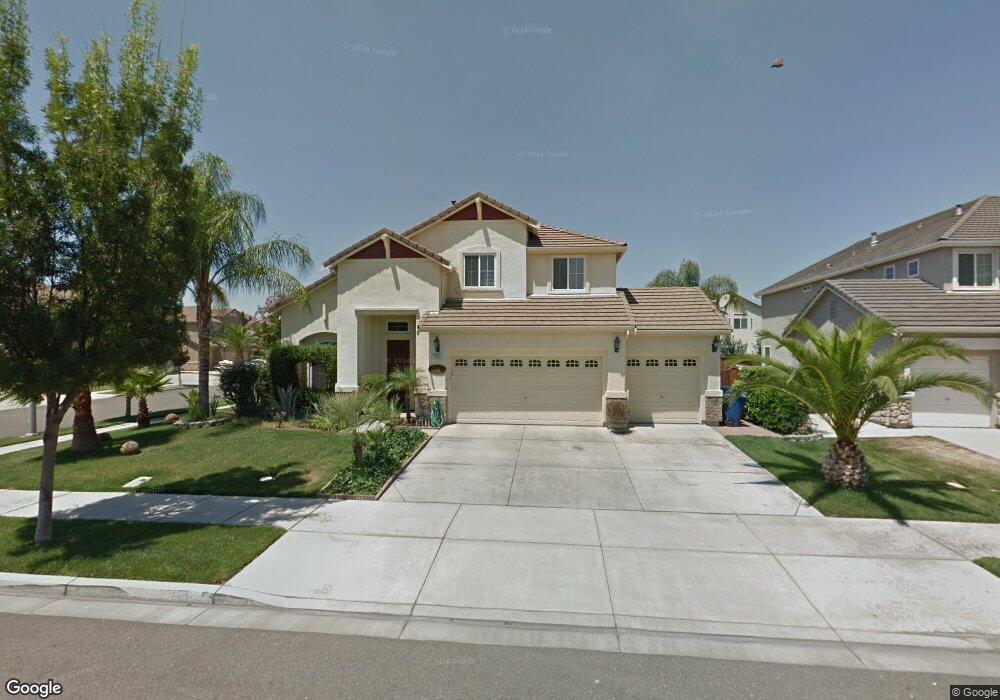
1813 Monterey Pine Ave Ceres, CA 95307
Mayfield NeighborhoodEstimated Value: $458,000 - $598,000
--
Bed
--
Bath
2,143
Sq Ft
$251/Sq Ft
Est. Value
About This Home
This home is located at 1813 Monterey Pine Ave, Ceres, CA 95307 and is currently estimated at $537,686, approximately $250 per square foot. 1813 Monterey Pine Ave is a home located in Stanislaus County with nearby schools including Samuel Vaughn Elementary School, Cesar Chavez Junior High School, and Ceres High School.
Ownership History
Date
Name
Owned For
Owner Type
Purchase Details
Closed on
Jun 1, 2009
Sold by
Espinoza Reynaldo and Espinoza Laura
Bought by
Espinoza Reynaldo and Espinoza Laura
Current Estimated Value
Home Financials for this Owner
Home Financials are based on the most recent Mortgage that was taken out on this home.
Original Mortgage
$157,000
Outstanding Balance
$99,248
Interest Rate
4.78%
Mortgage Type
New Conventional
Estimated Equity
$438,438
Purchase Details
Closed on
Nov 29, 2004
Sold by
Ceres Pinehurst Lp
Bought by
Garcia Reynaldo and Espinoza Laura
Home Financials for this Owner
Home Financials are based on the most recent Mortgage that was taken out on this home.
Original Mortgage
$254,992
Outstanding Balance
$127,615
Interest Rate
5.72%
Mortgage Type
Stand Alone First
Estimated Equity
$410,071
Create a Home Valuation Report for This Property
The Home Valuation Report is an in-depth analysis detailing your home's value as well as a comparison with similar homes in the area
Home Values in the Area
Average Home Value in this Area
Purchase History
| Date | Buyer | Sale Price | Title Company |
|---|---|---|---|
| Espinoza Reynaldo | -- | Chicago Title Company | |
| Garcia Reynaldo | -- | Alliance Title Company |
Source: Public Records
Mortgage History
| Date | Status | Borrower | Loan Amount |
|---|---|---|---|
| Open | Espinoza Reynaldo | $157,000 | |
| Open | Garcia Reynaldo | $254,992 |
Source: Public Records
Tax History Compared to Growth
Tax History
| Year | Tax Paid | Tax Assessment Tax Assessment Total Assessment is a certain percentage of the fair market value that is determined by local assessors to be the total taxable value of land and additions on the property. | Land | Improvement |
|---|---|---|---|---|
| 2024 | $5,264 | $435,568 | $122,985 | $312,583 |
| 2023 | $5,117 | $427,028 | $120,574 | $306,454 |
| 2022 | $5,058 | $418,656 | $118,210 | $300,446 |
| 2021 | $4,980 | $410,448 | $115,893 | $294,555 |
| 2020 | $4,389 | $366,000 | $105,000 | $261,000 |
| 2019 | $4,440 | $366,000 | $105,000 | $261,000 |
| 2018 | $4,192 | $345,500 | $105,000 | $240,500 |
| 2017 | $4,050 | $330,000 | $80,000 | $250,000 |
| 2016 | $3,690 | $299,500 | $80,000 | $219,500 |
| 2015 | $3,615 | $293,000 | $66,000 | $227,000 |
| 2014 | $3,302 | $266,500 | $60,000 | $206,500 |
Source: Public Records
Map
Nearby Homes
- 1812 Monterey Pine Ave
- 3786 Waynesboro Dr
- 1813 Poppy Ln
- 1506 Cavalier Ct
- 3204 Fowler Rd
- 3929 Mira Sol Dr
- 2208 Giant Oak Ln
- 2000 Cardinal Dr
- 2841 Fowler Rd Unit 149
- 2824 Dale Ave
- 2417 Louise Ave
- 1542 Rose Ave
- 2845 E Hatch Rd Unit 87
- 2720 Dale Ave
- 2640 Parkway
- 2816 Canyon Dr
- 2900 Canyon Falls Dr
- 1210 Snow Ridge Ct
- 1655 Moffett Rd
- 1651 Moffett Rd
- 1809 Monterey Pine Ave
- 1812 Fir Ln
- 1808 Fir Ln
- 1805 Monterey Pine Ave
- 3598 Beech Way
- 3584 Beech Way
- 1804 Fir Ln
- 1808 Monterey Pine Ave
- 1816 Monterey Pine Ave
- 3570 Beech Way
- 1804 Monterey Pine Ave
- 1801 Monterey Pine Ave
- 1820 Monterey Pine Ave
- 1800 Fir Ln
- 1800 Monterey Pine Ave
- 3556 Beech Way
- 1824 Monterey Pine Ave
- 3599 Helen Perry Rd
- 3585 Helen Perry Rd
- 1813 Fir Ln