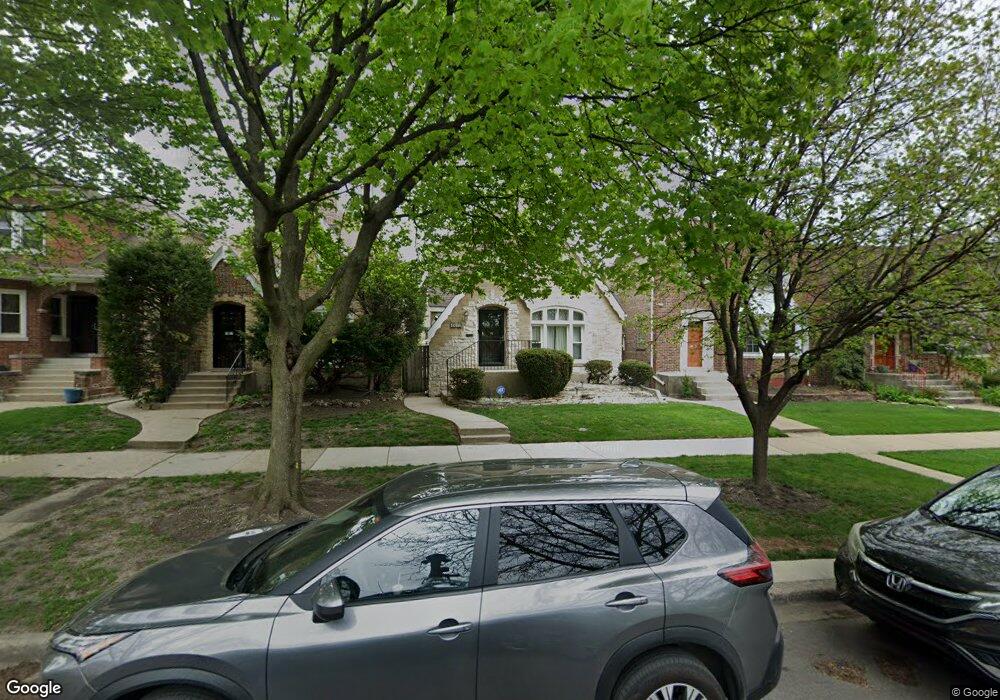
1813 N Newland Ave Chicago, IL 60707
Galewood NeighborhoodEstimated Value: $355,000 - $453,000
3
Beds
3
Baths
1,519
Sq Ft
$259/Sq Ft
Est. Value
About This Home
This home is located at 1813 N Newland Ave, Chicago, IL 60707 and is currently estimated at $393,744, approximately $259 per square foot. 1813 N Newland Ave is a home located in Cook County with nearby schools including Sayre Elementary Language Academy, Steinmetz College Prep, and Acero - Roberto Clemente Elementary School.
Ownership History
Date
Name
Owned For
Owner Type
Purchase Details
Closed on
Jun 21, 2013
Sold by
Popovic Ana
Bought by
Argueta Vilma
Current Estimated Value
Home Financials for this Owner
Home Financials are based on the most recent Mortgage that was taken out on this home.
Original Mortgage
$215,000
Outstanding Balance
$152,624
Interest Rate
3.52%
Mortgage Type
New Conventional
Estimated Equity
$241,120
Purchase Details
Closed on
Jun 15, 2012
Sold by
Mariscal Juan Manjel and Mariscal Rose Jackeline
Bought by
Popovic Ana
Home Financials for this Owner
Home Financials are based on the most recent Mortgage that was taken out on this home.
Original Mortgage
$220,000
Interest Rate
4.75%
Mortgage Type
New Conventional
Purchase Details
Closed on
Mar 13, 1997
Sold by
Kennedy John J
Bought by
Mariscal Juan Manuel and Mariscal Rose J
Home Financials for this Owner
Home Financials are based on the most recent Mortgage that was taken out on this home.
Original Mortgage
$155,750
Interest Rate
7.95%
Mortgage Type
FHA
Create a Home Valuation Report for This Property
The Home Valuation Report is an in-depth analysis detailing your home's value as well as a comparison with similar homes in the area
Home Values in the Area
Average Home Value in this Area
Purchase History
| Date | Buyer | Sale Price | Title Company |
|---|---|---|---|
| Argueta Vilma | $300,000 | -- | |
| Argueta Vilma | $300,000 | -- | |
| Popovic Ana | $276,000 | First American Title | |
| Mariscal Juan Manuel | $160,000 | Prairie Title |
Source: Public Records
Mortgage History
| Date | Status | Borrower | Loan Amount |
|---|---|---|---|
| Open | Argueta Vilma | $215,000 | |
| Closed | Argueta Vilma | $215,000 | |
| Previous Owner | Popovic Ana | $220,000 | |
| Previous Owner | Mariscal Juan Manuel | $155,750 |
Source: Public Records
Tax History Compared to Growth
Tax History
| Year | Tax Paid | Tax Assessment Tax Assessment Total Assessment is a certain percentage of the fair market value that is determined by local assessors to be the total taxable value of land and additions on the property. | Land | Improvement |
|---|---|---|---|---|
| 2024 | $4,694 | $33,000 | $11,625 | $21,375 |
| 2023 | $4,555 | $25,552 | $9,375 | $16,177 |
| 2022 | $4,555 | $25,552 | $9,375 | $16,177 |
| 2021 | $5,366 | $30,000 | $9,375 | $20,625 |
| 2020 | $4,550 | $23,517 | $4,687 | $18,830 |
| 2019 | $4,623 | $26,424 | $4,687 | $21,737 |
| 2018 | $6,683 | $37,249 | $4,687 | $32,562 |
| 2017 | $4,588 | $24,677 | $4,125 | $20,552 |
| 2016 | $4,921 | $27,051 | $4,125 | $22,926 |
| 2015 | $4,479 | $27,051 | $4,125 | $22,926 |
| 2014 | $3,509 | $21,466 | $3,750 | $17,716 |
| 2013 | $3,907 | $21,466 | $3,750 | $17,716 |
Source: Public Records
Map
Nearby Homes
- 1709 N Newland Ave
- 1701 N Newland Ave
- 1941 N New England Ave
- 1733 N Oak Park Ave
- 1905 N Nordica Ave
- 1916 N Rutherford Ave
- 1600 N New England Ave Unit 4
- 2048 N Oak Park Ave
- 1937 N Normandy Ave
- 1700 N Natoma Ave
- 1639 N Normandy Ave
- 2054 N Nordica Ave
- 1143 Woodbine Ave
- 1930 N Harlem Ave Unit 306
- 1930 N Harlem Ave Unit 402
- 1130 N Grove Ave
- 2037 N Harlem Ave Unit 3E
- 2016 N Harlem Ave Unit 7W
- 7182 W Dickens Ave Unit 2W
- 1227 N East Ave
- 1817 N Newland Ave
- 1811 N Newland Ave
- 1819 N Newland Ave
- 1819 N Newland Ave
- 1819 N Newland Ave Unit 2
- 1807 N Newland Ave
- 1805 N Newland Ave
- 1812 N New England Ave
- 1829 N Newland Ave
- 1816 N New England Ave
- 1810 N New England Ave
- 1806 N New England Ave
- 1818 N New England Ave
- 1804 N New England Ave
- 1824 N New England Ave
- 1800 N New England Ave
- 1833 N Newland Ave
- 1826 N New England Ave
- 1759 N Newland Ave
- 1830 N New England Ave