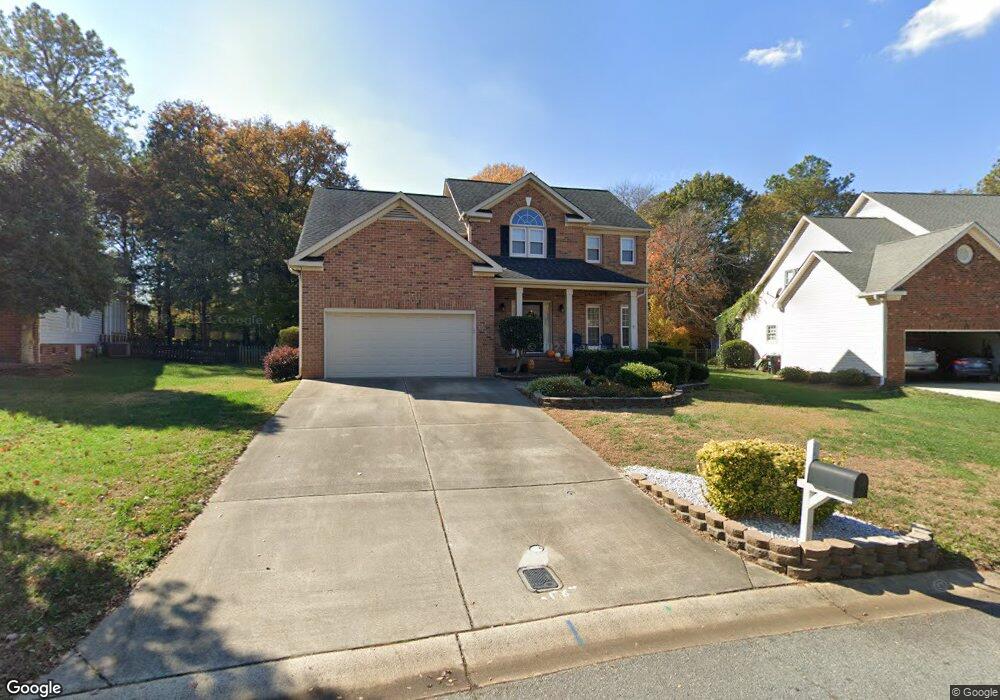
1813 Park Grove Place NW Unit 88 Concord, NC 28027
Estimated Value: $549,367 - $612,000
5
Beds
4
Baths
2,997
Sq Ft
$192/Sq Ft
Est. Value
About This Home
This home is located at 1813 Park Grove Place NW Unit 88, Concord, NC 28027 and is currently estimated at $576,842, approximately $192 per square foot. 1813 Park Grove Place NW Unit 88 is a home located in Cabarrus County with nearby schools including Carl A. Furr Elementary School, Harold E. Winkler Middle School, and Dogwood Classical Academy.
Ownership History
Date
Name
Owned For
Owner Type
Purchase Details
Closed on
May 10, 2018
Sold by
Crump Jeffrey L and Crump Tabetha H
Bought by
Harper David K and Harper Andrea R
Current Estimated Value
Home Financials for this Owner
Home Financials are based on the most recent Mortgage that was taken out on this home.
Original Mortgage
$288,915
Outstanding Balance
$248,994
Interest Rate
4.44%
Mortgage Type
New Conventional
Estimated Equity
$327,848
Purchase Details
Closed on
Jan 14, 2015
Sold by
Buchanan Mickey S and Buchanan Suzann R
Bought by
Crump Jeffrey L and Crump Tabetha H
Home Financials for this Owner
Home Financials are based on the most recent Mortgage that was taken out on this home.
Original Mortgage
$275,793
Interest Rate
4.25%
Mortgage Type
FHA
Purchase Details
Closed on
Mar 18, 1999
Sold by
Ridgway William A and Ridgway Deborah A
Bought by
Buchanan Mickey S and Buchanan Suzann R
Home Financials for this Owner
Home Financials are based on the most recent Mortgage that was taken out on this home.
Original Mortgage
$185,250
Interest Rate
6.25%
Purchase Details
Closed on
Jun 1, 1994
Purchase Details
Closed on
Jan 1, 1994
Create a Home Valuation Report for This Property
The Home Valuation Report is an in-depth analysis detailing your home's value as well as a comparison with similar homes in the area
Home Values in the Area
Average Home Value in this Area
Purchase History
| Date | Buyer | Sale Price | Title Company |
|---|---|---|---|
| Harper David K | $340,000 | None Available | |
| Crump Jeffrey L | $282,000 | None Available | |
| Buchanan Mickey S | $194,500 | -- | |
| -- | $170,500 | -- | |
| -- | $25,500 | -- |
Source: Public Records
Mortgage History
| Date | Status | Borrower | Loan Amount |
|---|---|---|---|
| Open | Harper David K | $288,915 | |
| Previous Owner | Crump Jeffrey L | $275,793 | |
| Previous Owner | Buchanan Mickey S | $185,250 |
Source: Public Records
Tax History Compared to Growth
Tax History
| Year | Tax Paid | Tax Assessment Tax Assessment Total Assessment is a certain percentage of the fair market value that is determined by local assessors to be the total taxable value of land and additions on the property. | Land | Improvement |
|---|---|---|---|---|
| 2025 | $5,378 | $539,980 | $100,000 | $439,980 |
| 2024 | $5,378 | $539,980 | $100,000 | $439,980 |
| 2023 | $4,259 | $349,090 | $58,000 | $291,090 |
| 2022 | $4,259 | $349,090 | $58,000 | $291,090 |
| 2021 | $4,259 | $349,090 | $58,000 | $291,090 |
| 2020 | $4,259 | $349,090 | $58,000 | $291,090 |
| 2019 | $3,682 | $301,830 | $47,000 | $254,830 |
| 2018 | $3,468 | $288,980 | $47,000 | $241,980 |
| 2017 | $3,410 | $288,980 | $47,000 | $241,980 |
| 2016 | $2,023 | $257,010 | $47,000 | $210,010 |
| 2015 | $3,033 | $257,010 | $47,000 | $210,010 |
| 2014 | $3,033 | $257,010 | $47,000 | $210,010 |
Source: Public Records
Map
Nearby Homes
- 5612 Meadow Bluff Ct NW
- 1735 Park Grove Place NW
- 5619 Weddington Rd
- 5711 Monticello Dr NW
- 5811 Monticello Dr NW
- 5807 Monticello Dr NW
- 5820 Wingate Way NW
- 1507 Chadmore Ln NW
- 4769 Covington Dr NW
- 1231 Bennington Dr NW
- 4940 Weddington Rd NW
- 4760 Lauren Glen St NW
- 4731 Asherton Place NW
- 4803 Chesney St NW
- 1337 Braeburn Rd NW
- 4831 Turnridge Ct NW
- 4827 Chesney St NW
- 888 Craigmont Ln NW
- 4835 Chesney St NW
- 159 Pitts School Rd NW
- 1813 Park Grove Place NW
- 1809 Park Grove Place NW
- 1817 Park Grove Place NW
- 1810 Moreland Wood Trail NW
- 1806 Moreland Wood Trail NW
- 5620 Meadow Bluff Ct NW
- 1821 Park Grove Place NW
- 1805 Park Grove Place NW
- 1814 Moreland Wood Trail NW
- 1802 Moreland Wood Trail NW
- 1818 Park Grove Place NW
- 5616 Meadow Bluff Ct NW
- 5624 Meadow Bluff Ct NW
- 1825 Park Grove Place NW
- 1822 Park Grove Place NW
- 1809 Moreland Wood Trail NW
- 1747 Park Grove Place NW
- 1829 Park Grove Place NW
- 1813 Moreland Wood Trail NW
- 1826 Park Grove Place NW