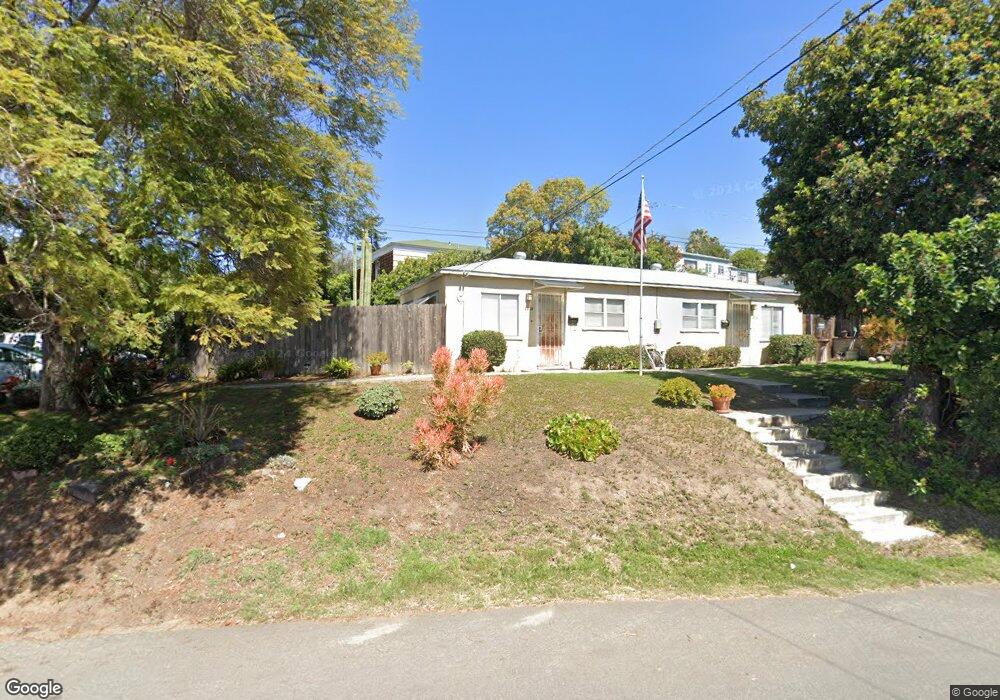
1814 Ensenada St Unit 16 Lemon Grove, CA 91945
Estimated Value: $649,072 - $846,000
2
Beds
2
Baths
874
Sq Ft
$863/Sq Ft
Est. Value
About This Home
This home is located at 1814 Ensenada St Unit 16, Lemon Grove, CA 91945 and is currently estimated at $754,018, approximately $862 per square foot. 1814 Ensenada St Unit 16 is a home located in San Diego County with nearby schools including Monterey Heights Elementary, Mount Miguel High School, and Keiller Leadership Academy.
Ownership History
Date
Name
Owned For
Owner Type
Purchase Details
Closed on
May 25, 2023
Sold by
Freeman Jennie L
Bought by
Jennie Freeman 2023 Living Trust
Current Estimated Value
Purchase Details
Closed on
Jul 5, 2001
Sold by
Shaffer Ernest M and Shaffer Mae E
Bought by
Freeman Jennie L
Home Financials for this Owner
Home Financials are based on the most recent Mortgage that was taken out on this home.
Original Mortgage
$126,750
Interest Rate
9.9%
Purchase Details
Closed on
Dec 27, 2000
Sold by
Shaffer Ernest M and Shaffer Mae E
Bought by
Shaffer Ernest M and Shaffer Mae E
Create a Home Valuation Report for This Property
The Home Valuation Report is an in-depth analysis detailing your home's value as well as a comparison with similar homes in the area
Home Values in the Area
Average Home Value in this Area
Purchase History
| Date | Buyer | Sale Price | Title Company |
|---|---|---|---|
| Jennie Freeman 2023 Living Trust | -- | None Listed On Document | |
| Freeman Jennie L | $169,000 | American Title Ins Co | |
| Shaffer Ernest M | -- | -- |
Source: Public Records
Mortgage History
| Date | Status | Borrower | Loan Amount |
|---|---|---|---|
| Previous Owner | Freeman Jennie L | $126,750 | |
| Closed | Freeman Jennie L | $42,250 |
Source: Public Records
Tax History Compared to Growth
Tax History
| Year | Tax Paid | Tax Assessment Tax Assessment Total Assessment is a certain percentage of the fair market value that is determined by local assessors to be the total taxable value of land and additions on the property. | Land | Improvement |
|---|---|---|---|---|
| 2025 | $4,218 | $249,638 | $103,541 | $146,097 |
| 2024 | $4,218 | $244,744 | $101,511 | $143,233 |
| 2023 | $4,134 | $235,242 | $97,570 | $137,672 |
| 2022 | $4,116 | $235,242 | $97,570 | $137,672 |
| 2021 | $4,073 | $230,630 | $95,657 | $134,973 |
| 2020 | $4,011 | $228,267 | $94,677 | $133,590 |
| 2019 | $3,936 | $223,792 | $92,821 | $130,971 |
| 2018 | $3,842 | $219,404 | $91,001 | $128,403 |
| 2017 | $3,773 | $215,103 | $89,217 | $125,886 |
| 2016 | $3,624 | $210,886 | $87,468 | $123,418 |
| 2015 | $3,606 | $207,720 | $86,155 | $121,565 |
| 2014 | $3,483 | $203,652 | $84,468 | $119,184 |
Source: Public Records
Map
Nearby Homes
- 1795 Lemon Grove Ave
- 1928 Noble St
- 2108 El Prado Ave
- 2240-42 El Prado Ave
- 2030 Fairhaven St
- 1607 Watwood Rd
- 1701 Dayton Dr
- 1737-41 Glencoe Dr
- 1942 Madera St
- 2127 Berry St
- 1915 Englewood Dr
- 1015 Harlan Cir
- 7083 Berry Park Ln
- 1062 Armacost Rd
- 7065 Berry Park Ln
- 0 Dartmoor Dr Unit 1
- 2674 Buena Vista Ave
- 7015 Lermas Ct
- 8046-48 Sarawak Dr
- 2673 Massachusetts Ave
- 1803 Eldora St
- 1820 Ensenada St
- 1795 El Dora St
- 1795 Eldora St #97
- 1795 Eldora St Unit 97
- 1805 Eldora St
- 1825 Ensenada St
- 1830 Ensenada St
- 1821 Ensenada St
- 1815 Ensenada St
- 1807 Ensenada St
- 1840 Ensenada St
- 1803 Ensenada St
- 1827 Bakersfield St
- 1825 Ensendada St
- 1815 Eldora St
- 1786 El Dora St
- 1804 Eldora St
- 1815 El Dora St
- 1775 Ensenada St