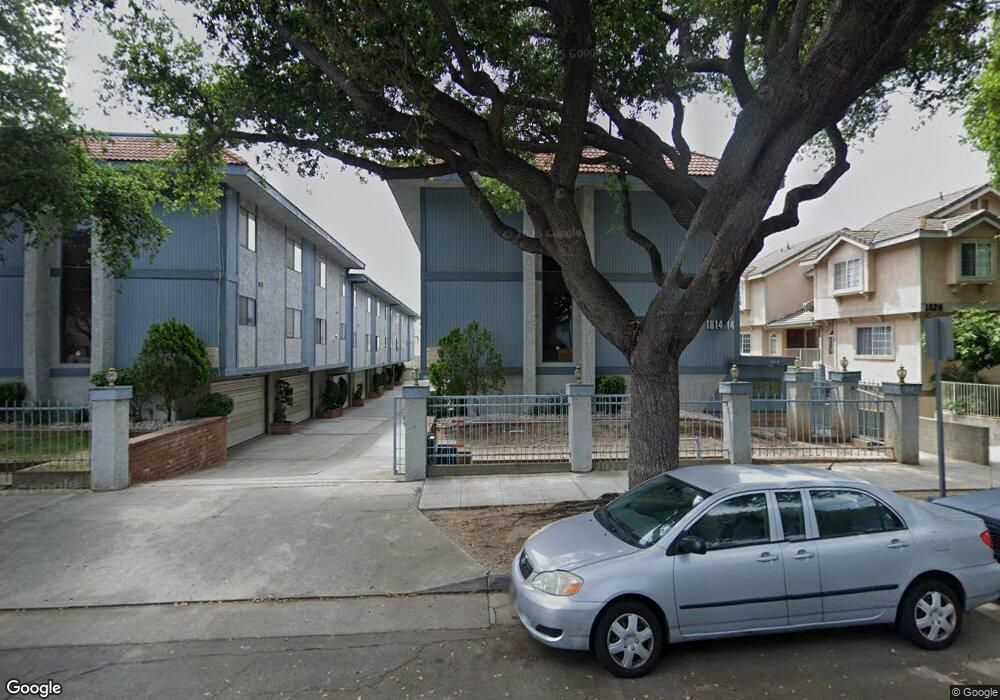
1814 Pepper St Unit 2 Alhambra, CA 91801
Dolgeville NeighborhoodEstimated Value: $788,000 - $1,072,000
3
Beds
3
Baths
1,470
Sq Ft
$598/Sq Ft
Est. Value
About This Home
This home is located at 1814 Pepper St Unit 2, Alhambra, CA 91801 and is currently estimated at $878,704, approximately $597 per square foot. 1814 Pepper St Unit 2 is a home located in Los Angeles County with nearby schools including William Northrup Elementary School, Alhambra High School, and All Souls World Language Catholic School.
Ownership History
Date
Name
Owned For
Owner Type
Purchase Details
Closed on
Apr 13, 2015
Sold by
Luo Xiangyang
Bought by
Luo Xiangyang and Cao Jun
Current Estimated Value
Home Financials for this Owner
Home Financials are based on the most recent Mortgage that was taken out on this home.
Original Mortgage
$318,750
Outstanding Balance
$245,914
Interest Rate
3.8%
Mortgage Type
New Conventional
Estimated Equity
$632,790
Purchase Details
Closed on
Jun 24, 2002
Sold by
Lee Krol
Bought by
Luo Xiangyang
Home Financials for this Owner
Home Financials are based on the most recent Mortgage that was taken out on this home.
Original Mortgage
$191,200
Interest Rate
6.78%
Purchase Details
Closed on
May 31, 2000
Sold by
Lee Krol
Bought by
Lee Krol and Leung Rebecca
Create a Home Valuation Report for This Property
The Home Valuation Report is an in-depth analysis detailing your home's value as well as a comparison with similar homes in the area
Home Values in the Area
Average Home Value in this Area
Purchase History
| Date | Buyer | Sale Price | Title Company |
|---|---|---|---|
| Luo Xiangyang | -- | Nations Title Company | |
| Luo Xiangyang | $244,000 | Fidelity Title | |
| Lee Krol | -- | -- |
Source: Public Records
Mortgage History
| Date | Status | Borrower | Loan Amount |
|---|---|---|---|
| Open | Luo Xiangyang | $318,750 | |
| Closed | Luo Xiangyang | $191,200 |
Source: Public Records
Tax History
| Year | Tax Paid | Tax Assessment Tax Assessment Total Assessment is a certain percentage of the fair market value that is determined by local assessors to be the total taxable value of land and additions on the property. | Land | Improvement |
|---|---|---|---|---|
| 2025 | $4,425 | $353,083 | $172,777 | $180,306 |
| 2024 | $4,425 | $346,161 | $169,390 | $176,771 |
| 2023 | $4,398 | $339,374 | $166,069 | $173,305 |
| 2022 | $4,190 | $332,720 | $162,813 | $169,907 |
| 2021 | $4,142 | $326,197 | $159,621 | $166,576 |
| 2019 | $3,998 | $316,524 | $154,888 | $161,636 |
| 2018 | $4,016 | $310,318 | $151,851 | $158,467 |
| 2016 | $3,690 | $298,269 | $145,955 | $152,314 |
| 2015 | $3,636 | $293,790 | $143,763 | $150,027 |
| 2014 | $3,514 | $288,036 | $140,947 | $147,089 |
Source: Public Records
Map
Nearby Homes
- 1712 Pepper St
- 1515 W Commonwealth Ave
- 1712 Vine St Unit D
- 1805 Vine St Unit F
- 105 S Marguerita Ave Unit F
- 1713 Vine St Unit B
- 611 S Marguerita Ave
- 228 S Olive Ave Unit A302
- 600 La Paloma Ave
- 213 S Atlantic Blvd
- 1412 Larch St
- 218 La France Ave Unit E
- 408 1B W Main
- 104 106 E Linda Vista Ave
- 814 S Electric Ln
- 1712 Front St
- 1014 S Marengo Ave Unit 7
- 312 N Marguerita Ave
- 805 S Olive Ave
- 1100 S Ethel Ave
- 1814 Pepper St Unit 1
- 1814 Pepper St Unit 3
- 1814 Pepper St Unit 4
- 1814 Pepper St Unit 5
- 1814 Pepper St Unit 6
- 1814 Pepper St Unit 7
- 1812 Pepper St Unit 7
- 1812 Pepper St Unit 6
- 1812 Pepper St Unit 5
- 1812 Pepper St Unit 4
- 1812 Pepper St Unit 3
- 1812 Pepper St Unit 2
- 1812 Pepper St Unit 1
- 1820 Pepper St Unit E
- 1808 Pepper St
- 1900 Pepper St Unit 13
- 1900 Pepper St Unit 11
- 1900 Pepper St Unit 9
- 1900 Pepper St Unit 8
- 1900 Pepper St Unit 7
Your Personal Tour Guide
Ask me questions while you tour the home.