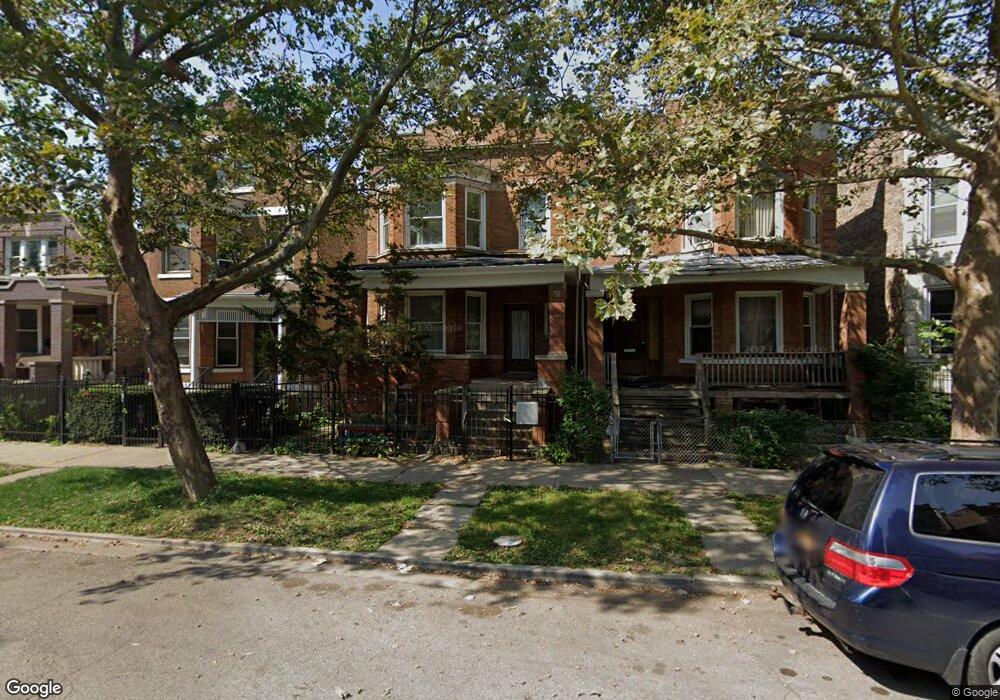
1814 S Troy St Unit 2 Chicago, IL 60623
North Lawndale NeighborhoodEstimated Value: $351,000 - $381,706
5
Beds
3
Baths
2,748
Sq Ft
$133/Sq Ft
Est. Value
About This Home
This home is located at 1814 S Troy St Unit 2, Chicago, IL 60623 and is currently estimated at $364,427, approximately $132 per square foot. 1814 S Troy St Unit 2 is a home located in Cook County with nearby schools including Johnson Elementary School, Legacy Elementary Charter School, and Latino Youth High School.
Ownership History
Date
Name
Owned For
Owner Type
Purchase Details
Closed on
May 25, 2022
Sold by
Slusser Brian and Slusser Alysia
Bought by
Campion Paul John
Current Estimated Value
Home Financials for this Owner
Home Financials are based on the most recent Mortgage that was taken out on this home.
Original Mortgage
$256,000
Outstanding Balance
$242,642
Interest Rate
5%
Mortgage Type
New Conventional
Estimated Equity
$121,785
Purchase Details
Closed on
Mar 11, 2014
Sold by
Federal Home Loan Mortgage Corporation
Bought by
Slusser Brian and Slusser Alysia
Purchase Details
Closed on
Aug 9, 2013
Sold by
Galindo Ricardo A
Bought by
Federal Home Loan Mortgage Corporation
Purchase Details
Closed on
Feb 1, 2006
Sold by
House Lucille L
Bought by
Galindo Ricardo A and Sanz Piedad M
Home Financials for this Owner
Home Financials are based on the most recent Mortgage that was taken out on this home.
Original Mortgage
$196,000
Interest Rate
5.4%
Mortgage Type
Purchase Money Mortgage
Create a Home Valuation Report for This Property
The Home Valuation Report is an in-depth analysis detailing your home's value as well as a comparison with similar homes in the area
Home Values in the Area
Average Home Value in this Area
Purchase History
| Date | Buyer | Sale Price | Title Company |
|---|---|---|---|
| Campion Paul John | $320,000 | None Listed On Document | |
| Slusser Brian | $60,000 | Attorneys Title Guaranty Fun | |
| Federal Home Loan Mortgage Corporation | -- | None Available | |
| Galindo Ricardo A | $245,000 | Ticor Title |
Source: Public Records
Mortgage History
| Date | Status | Borrower | Loan Amount |
|---|---|---|---|
| Open | Campion Paul John | $256,000 | |
| Previous Owner | Galindo Ricardo A | $196,000 |
Source: Public Records
Tax History Compared to Growth
Tax History
| Year | Tax Paid | Tax Assessment Tax Assessment Total Assessment is a certain percentage of the fair market value that is determined by local assessors to be the total taxable value of land and additions on the property. | Land | Improvement |
|---|---|---|---|---|
| 2024 | $2,976 | $17,607 | $4,855 | $12,752 |
| 2023 | $4,247 | $17,372 | $3,934 | $13,438 |
| 2022 | $4,247 | $24,000 | $3,934 | $20,066 |
| 2021 | $4,170 | $23,999 | $3,933 | $20,066 |
| 2020 | $3,506 | $18,787 | $3,933 | $14,854 |
| 2019 | $3,517 | $20,875 | $3,933 | $16,942 |
| 2018 | $3,456 | $20,875 | $3,933 | $16,942 |
| 2017 | $3,584 | $19,969 | $3,515 | $16,454 |
| 2016 | $4,000 | $19,969 | $3,515 | $16,454 |
| 2015 | $3,659 | $19,969 | $3,515 | $16,454 |
| 2014 | $3,508 | $18,909 | $3,348 | $15,561 |
| 2013 | $3,439 | $18,909 | $3,348 | $15,561 |
Source: Public Records
Map
Nearby Homes
- 1609 S Sawyer Ave
- 1607 S Sawyer Ave
- 1918 S Kedzie Ave
- 1908 S Sawyer Ave
- 1635 S Christiana Ave
- 1654 S Christiana Ave
- 1532 S Kedzie Ave
- 1918 S Christiana Ave
- 1922 S Christiana Ave
- 1546 S Christiana Ave
- 1921 S Homan Ave
- 1847 S Sawyer Ave
- 1520 S Christiana Ave
- 1554 S Homan Ave
- 3349 W 21st St
- 1549 S Trumbull Ave
- 1510 S Homan Ave
- 2103 S Trumbull Ave
- 3301 W Douglas Blvd
- 1921 S Saint Louis Ave
- 1814 S Troy St
- 1812 S Troy St
- 1816 S Troy St
- 1816 S Troy St
- 1808 S Troy St
- 1808 S Troy St Unit 2
- 1818 S Troy St
- 1806 S Troy St
- 1806 S Troy St
- 1822 S Troy St
- 1802 S Troy St Unit 3
- 1802 S Troy St
- 1802 S Troy St
- 1824 S Troy St Unit 2DNFL
- 1800 S Troy St Unit 1
- 1800 S Troy St
- 1835 S Kedzie Ave
- 1835 S Kedzie Ave
- 1828 S Troy St
- 1815 S Troy St