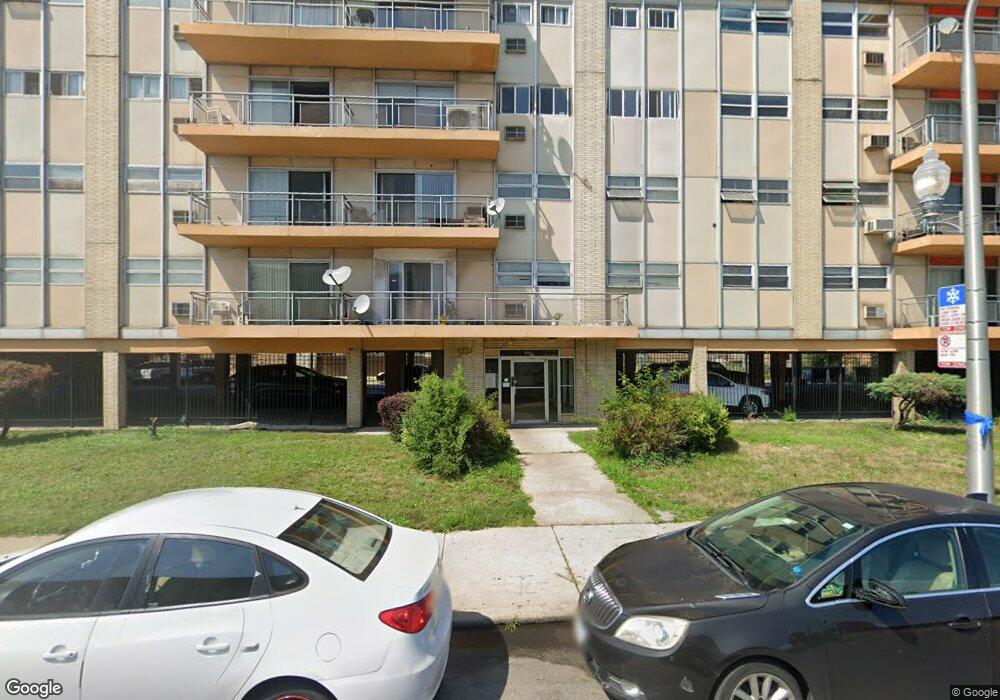
1814 W 79th St Unit 208 Chicago, IL 60620
Auburn Gresham NeighborhoodEstimated Value: $38,000 - $101,000
--
Bed
--
Bath
4,000
Sq Ft
$15/Sq Ft
Est. Value
About This Home
This home is located at 1814 W 79th St Unit 208, Chicago, IL 60620 and is currently estimated at $60,876, approximately $15 per square foot. 1814 W 79th St Unit 208 is a home located in Cook County with nearby schools including Barton Elementary School and Bogan Computer Technical High School.
Ownership History
Date
Name
Owned For
Owner Type
Purchase Details
Closed on
Nov 7, 2005
Sold by
Daniels Willie
Bought by
Daniels Wilbert R
Current Estimated Value
Home Financials for this Owner
Home Financials are based on the most recent Mortgage that was taken out on this home.
Original Mortgage
$51,300
Outstanding Balance
$33,295
Interest Rate
9.25%
Mortgage Type
Fannie Mae Freddie Mac
Estimated Equity
$27,581
Purchase Details
Closed on
Jun 30, 2003
Sold by
Bank One Na
Bought by
Daniels Willie
Purchase Details
Closed on
Mar 4, 2003
Sold by
Jideonwo Peter and Gideonwo Peter C
Bought by
Bank One Na
Purchase Details
Closed on
Mar 23, 1999
Sold by
Hope Development Center
Bought by
Jideonwo Peter
Home Financials for this Owner
Home Financials are based on the most recent Mortgage that was taken out on this home.
Original Mortgage
$26,600
Interest Rate
11.04%
Purchase Details
Closed on
Dec 17, 1998
Sold by
Hud
Bought by
Hope Development Center
Create a Home Valuation Report for This Property
The Home Valuation Report is an in-depth analysis detailing your home's value as well as a comparison with similar homes in the area
Home Values in the Area
Average Home Value in this Area
Purchase History
| Date | Buyer | Sale Price | Title Company |
|---|---|---|---|
| Daniels Wilbert R | $57,000 | Multiple | |
| Daniels Willie | $28,000 | Git | |
| Bank One Na | -- | -- | |
| Jideonwo Peter | $38,000 | -- | |
| Hope Development Center | -- | -- |
Source: Public Records
Mortgage History
| Date | Status | Borrower | Loan Amount |
|---|---|---|---|
| Open | Daniels Wilbert R | $51,300 | |
| Previous Owner | Jideonwo Peter | $26,600 |
Source: Public Records
Tax History Compared to Growth
Tax History
| Year | Tax Paid | Tax Assessment Tax Assessment Total Assessment is a certain percentage of the fair market value that is determined by local assessors to be the total taxable value of land and additions on the property. | Land | Improvement |
|---|---|---|---|---|
| 2024 | $514 | $3,131 | $220 | $2,911 |
| 2023 | $514 | $2,500 | $353 | $2,147 |
| 2022 | $514 | $2,500 | $353 | $2,147 |
| 2021 | $573 | $2,499 | $352 | $2,147 |
| 2020 | $573 | $2,572 | $352 | $2,220 |
| 2019 | $0 | $2,847 | $352 | $2,495 |
| 2018 | $0 | $2,847 | $352 | $2,495 |
| 2017 | $570 | $2,648 | $308 | $2,340 |
| 2016 | $30 | $2,648 | $308 | $2,340 |
| 2015 | $485 | $2,648 | $308 | $2,340 |
| 2014 | $322 | $4,304 | $176 | $4,128 |
| 2013 | $305 | $4,304 | $176 | $4,128 |
Source: Public Records
Map
Nearby Homes
- 7843 S Honore St
- 1818 W 78th St
- 7928 S Hermitage Ave
- 7755 S Wolcott Ave
- 7921 S Hermitage Ave
- 7828 S Winchester Ave
- 7838 S Paulina St
- 7801 S Hermitage Ave
- 7742 S Hermitage Ave
- 8012 S Honore St
- 7723 S Honore St
- 7725 S Wood St
- 8023 S Wood St
- 7711 S Honore St
- 7755 S Paulina St
- 8051 S Honore St
- 2024 W 79th Place
- 2028 W 80th St
- 7811 S Hoyne Ave
- 8019 S Marshfield Ave
- 1814 W 79th St Unit 301
- 1814 W 79th St Unit 310
- 1814 W 79th St
- 1814 W 79th St
- 1814 W 79th St
- 1814 W 79th St
- 1814 W 79th St Unit 410
- 1814 W 79th St Unit 502
- 1814 W 79th St Unit 510
- 1814 W 79th St Unit 210
- 1814 W 79th St Unit 203
- 1814 W 79th St Unit 408
- 1814 W 79th St Unit 504
- 1814 W 79th St Unit 406
- 1814 W 79th St Unit 405
- 1814 W 79th St Unit 304
- 1814 W 79th St Unit 205
- 1814 W 79th St Unit 508
- 1814 W 79th St Unit 204
- 1814 W 79th St Unit 401