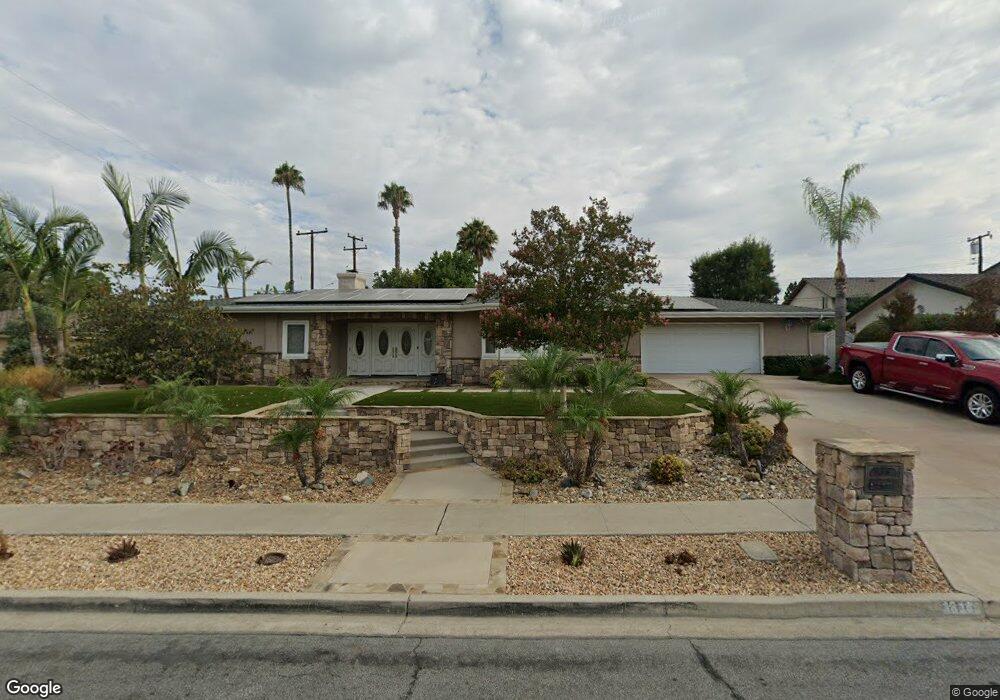
18141 Joshua Ln Santa Ana, CA 92705
Estimated Value: $1,673,147 - $1,965,000
4
Beds
3
Baths
2,462
Sq Ft
$741/Sq Ft
Est. Value
About This Home
This home is located at 18141 Joshua Ln, Santa Ana, CA 92705 and is currently estimated at $1,824,787, approximately $741 per square foot. 18141 Joshua Ln is a home located in Orange County with nearby schools including Loma Vista Elementary School, Hewes Middle School, and Foothill High School.
Ownership History
Date
Name
Owned For
Owner Type
Purchase Details
Closed on
Oct 29, 1997
Sold by
Marovic Marija
Bought by
Harper Marc D and Harper Lura L
Current Estimated Value
Home Financials for this Owner
Home Financials are based on the most recent Mortgage that was taken out on this home.
Original Mortgage
$278,400
Interest Rate
7.36%
Purchase Details
Closed on
Feb 25, 1997
Sold by
Compean Robert J
Bought by
Marovic Marija
Purchase Details
Closed on
Dec 3, 1996
Sold by
Campean Robert
Bought by
Marovic Marija
Purchase Details
Closed on
Apr 9, 1996
Sold by
Home Svgs Of America Fsb
Bought by
Marovic Marija
Home Financials for this Owner
Home Financials are based on the most recent Mortgage that was taken out on this home.
Original Mortgage
$207,000
Interest Rate
7.75%
Purchase Details
Closed on
Nov 13, 1995
Sold by
Kittle Brent N and Kittle Jackie L
Bought by
Home Svgs Of America
Create a Home Valuation Report for This Property
The Home Valuation Report is an in-depth analysis detailing your home's value as well as a comparison with similar homes in the area
Home Values in the Area
Average Home Value in this Area
Purchase History
| Date | Buyer | Sale Price | Title Company |
|---|---|---|---|
| Harper Marc D | $348,000 | First American Title Ins Co | |
| Marovic Marija | -- | Fidelity National Title Ins | |
| Marovic Marija | -- | -- | |
| Marovic Marija | $310,000 | California Counties Title Co | |
| Home Svgs Of America | $246,500 | Continental Lawyers Title Co |
Source: Public Records
Mortgage History
| Date | Status | Borrower | Loan Amount |
|---|---|---|---|
| Previous Owner | Harper Marc D | $278,400 | |
| Previous Owner | Marovic Marija | $207,000 | |
| Closed | Harper Marc D | $52,200 |
Source: Public Records
Tax History Compared to Growth
Tax History
| Year | Tax Paid | Tax Assessment Tax Assessment Total Assessment is a certain percentage of the fair market value that is determined by local assessors to be the total taxable value of land and additions on the property. | Land | Improvement |
|---|---|---|---|---|
| 2025 | $8,179 | $740,266 | $333,406 | $406,860 |
| 2024 | $8,179 | $725,751 | $326,868 | $398,883 |
| 2023 | $6,859 | $605,754 | $320,459 | $285,295 |
| 2022 | $6,149 | $537,264 | $314,175 | $223,089 |
| 2021 | $6,025 | $526,730 | $308,015 | $218,715 |
| 2020 | $5,993 | $521,330 | $304,857 | $216,473 |
| 2019 | $5,847 | $511,108 | $298,879 | $212,229 |
| 2018 | $5,751 | $501,087 | $293,019 | $208,068 |
| 2017 | $5,650 | $491,262 | $287,273 | $203,989 |
| 2016 | $5,549 | $481,630 | $281,640 | $199,990 |
| 2015 | $5,609 | $474,396 | $277,410 | $196,986 |
| 2014 | $5,465 | $465,104 | $271,976 | $193,128 |
Source: Public Records
Map
Nearby Homes
- 13772 Sanderstead Rd
- 18201 Leafwood Ln
- 13441 Laurinda Way
- 14141 Clarissa Ln
- 13702 Loretta Dr
- 17562 Laurie Ln
- 18101 Kirk Ave
- 13082 Palomar Way
- 17991 Lassen Dr
- 13762 Palace Way
- 17771 Orange Tree Ln
- 14291 Prospect Ave
- 17522 Vandenberg Ln Unit 3
- 18812 Oak Ridge Dr
- 17841 Lucero Way
- 18572 Fairhaven Ave
- 17902 Lucero Way
- 17922 Romelle Ave
- 3315 E Romelle Ave
- 13822 Deodar St
- 18161 Joshua Ln
- 18121 Joshua Ln
- 18142 Estes Way
- 18122 Estes Way
- 18122 Joshua Ln
- 18142 Joshua Ln
- 18111 Joshua Ln
- 18171 Joshua Ln
- 18162 Joshua Ln
- 18112 Joshua Ln
- 18162 Estes Way
- 13722 Carlsbad Dr
- 13732 Carlsbad Dr
- 13702 Carlsbad Dr
- 13792 Allthorn Dr
- 13801 Allthorn Dr
- 18181 Joshua Ln
- 18071 Joshua Ln
- 18092 Joshua Ln
- 18182 Joshua Ln