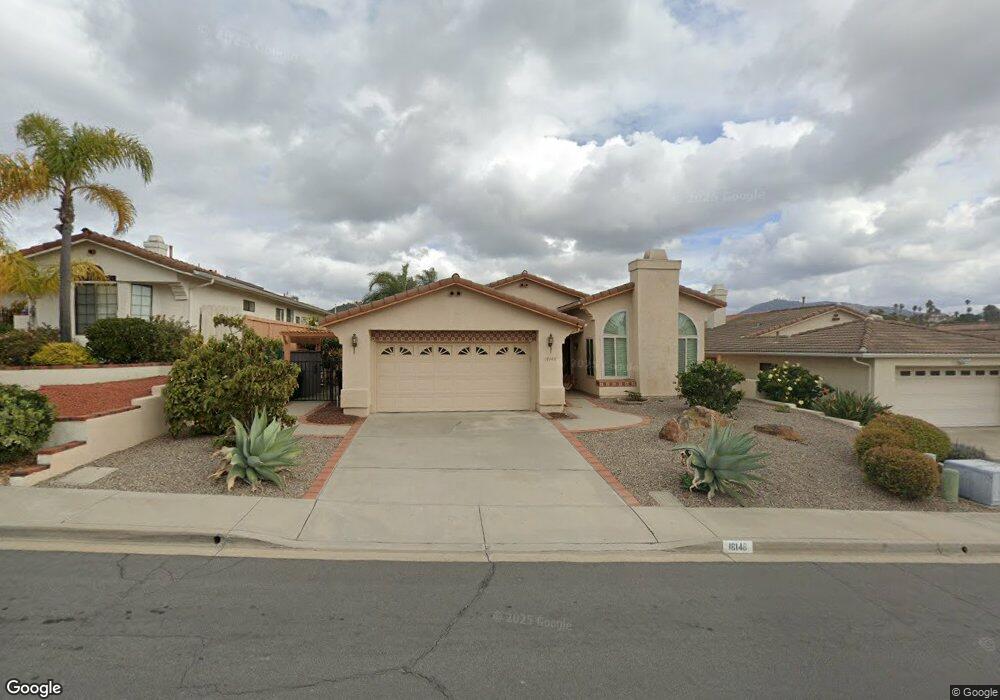
18148 Calle Estepona San Diego, CA 92128
Rancho Bernardo NeighborhoodEstimated Value: $1,112,846 - $1,211,000
3
Beds
2
Baths
1,630
Sq Ft
$719/Sq Ft
Est. Value
About This Home
This home is located at 18148 Calle Estepona, San Diego, CA 92128 and is currently estimated at $1,171,462, approximately $718 per square foot. 18148 Calle Estepona is a home located in San Diego County with nearby schools including Chaparral Elementary, Bernardo Heights Middle, and Rancho Bernardo High.
Ownership History
Date
Name
Owned For
Owner Type
Purchase Details
Closed on
Jul 26, 2019
Sold by
Johnston Robert L and Johnston Joyce C
Bought by
Liu Wu Ken Shin An and Liu Wu Mary Meei Ing
Current Estimated Value
Purchase Details
Closed on
Sep 15, 2008
Sold by
Quatman Evelyn F
Bought by
Johnston Robert L and Johnston Joyce C
Home Financials for this Owner
Home Financials are based on the most recent Mortgage that was taken out on this home.
Original Mortgage
$350,000
Interest Rate
6.39%
Mortgage Type
Unknown
Purchase Details
Closed on
Oct 16, 2000
Sold by
Quatman George W
Bought by
Quatman George W
Purchase Details
Closed on
Nov 30, 1998
Sold by
Quatman Evelyn F
Bought by
Quatman George W
Purchase Details
Closed on
Feb 25, 1994
Sold by
Quatman George W and Quatman Evelyn F
Bought by
Quatman George W and Quatman Evelyn F
Purchase Details
Closed on
Sep 13, 1990
Purchase Details
Closed on
Jul 20, 1988
Create a Home Valuation Report for This Property
The Home Valuation Report is an in-depth analysis detailing your home's value as well as a comparison with similar homes in the area
Home Values in the Area
Average Home Value in this Area
Purchase History
| Date | Buyer | Sale Price | Title Company |
|---|---|---|---|
| Liu Wu Ken Shin An | $720,000 | Lawyers Title | |
| Johnston Robert L | $522,500 | Fidelity National Title | |
| Quatman George W | -- | -- | |
| Quatman George W | -- | -- | |
| Quatman George W | -- | -- | |
| Quatman George W | -- | -- | |
| -- | $310,000 | -- | |
| -- | $209,900 | -- |
Source: Public Records
Mortgage History
| Date | Status | Borrower | Loan Amount |
|---|---|---|---|
| Previous Owner | Johnston Robert L | $350,000 |
Source: Public Records
Tax History Compared to Growth
Tax History
| Year | Tax Paid | Tax Assessment Tax Assessment Total Assessment is a certain percentage of the fair market value that is determined by local assessors to be the total taxable value of land and additions on the property. | Land | Improvement |
|---|---|---|---|---|
| 2025 | $8,667 | $787,420 | $376,756 | $410,664 |
| 2024 | $8,667 | $771,981 | $369,369 | $402,612 |
| 2023 | $8,482 | $756,845 | $362,127 | $394,718 |
| 2022 | $8,339 | $742,006 | $355,027 | $386,979 |
| 2021 | $8,229 | $727,458 | $348,066 | $379,392 |
| 2020 | $8,118 | $720,000 | $344,498 | $375,502 |
| 2019 | $6,752 | $603,152 | $288,590 | $314,562 |
| 2018 | $6,561 | $591,327 | $282,932 | $308,395 |
| 2017 | $6,384 | $579,734 | $277,385 | $302,349 |
| 2016 | $6,049 | $550,000 | $261,000 | $289,000 |
| 2015 | $5,884 | $535,000 | $254,000 | $281,000 |
| 2014 | $5,750 | $525,000 | $250,000 | $275,000 |
Source: Public Records
Map
Nearby Homes
- 12725 Via Nasca
- 18035 Avenida Alozdra Unit 298
- 18018 Calle Estepona
- 17909 Avenida Alozdra
- 13356 Corte de Chucena
- 12870 Camino de la Breccia
- 18787 Aceituno St
- 12865 Camino de la Breccia Unit 109
- 12880 Circulo Dardo
- 18818 Bernardo Trails Dr Unit 6
- 17780 Cumana Terrace
- 13025 Avenida Marbella
- 13060 Avenida Marbella
- 17762 Plaza Acosta
- 17738 Plaza Acosta
- 17842 Avenida Cordillera Unit 30
- 12732 Camino de la Breccia Unit 9
- 12977 Camino Emparrado
- 13391 Old Winemaster Ct
- 17676 Corte Sobrado
- 18140 Calle Estepona Unit 2
- 18158 Calle Estepona
- 18130 Calle Estepona
- 18166 Calle Estepona
- 18149 Calle Estepona
- 18141 Calle Estepona
- 18122 Calle Estepona
- 18176 Calle Estepona
- 18159 Calle Estepona
- 18169 Calle Estepona
- 18566 Aceituno St
- 18112 Calle Estepona Unit 2
- 18123 Calle Estepona
- 18184 Calle Estepona
- 18526 Aceituno St
- 18187 Calle Estepona
- 18113 Calle Estepona
- 18104 Calle Estepona
- 18192 Calle Estepona
- 18193 Calle Estepona