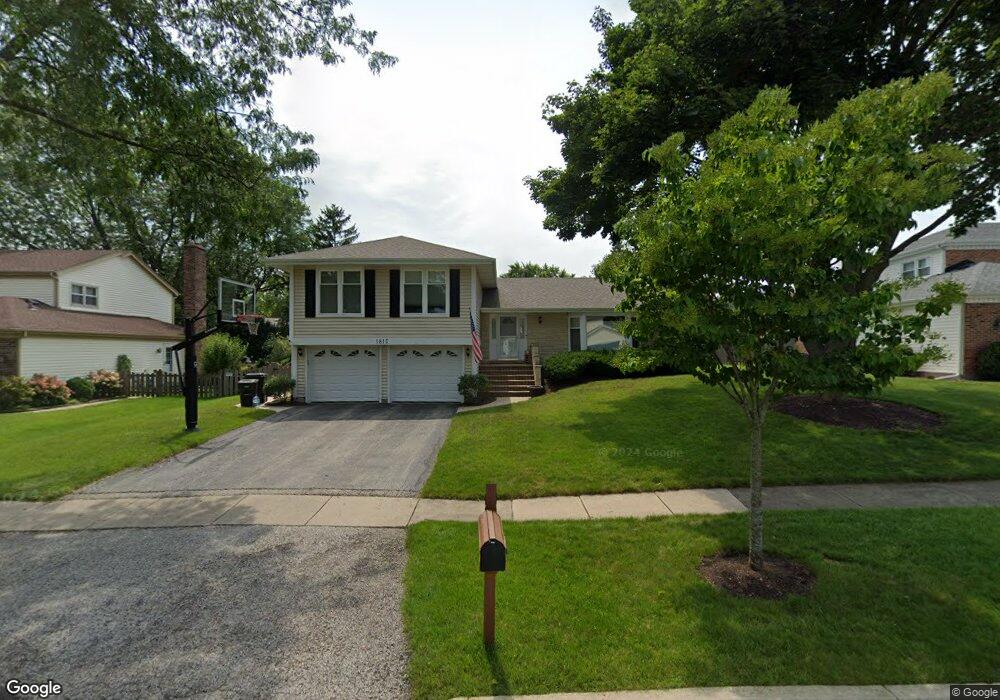
1815 Bishop Way Unit 3 Mundelein, IL 60060
Tullamore NeighborhoodEstimated Value: $267,000 - $463,000
4
Beds
3
Baths
1,735
Sq Ft
$213/Sq Ft
Est. Value
About This Home
This home is located at 1815 Bishop Way Unit 3, Mundelein, IL 60060 and is currently estimated at $368,875, approximately $212 per square foot. 1815 Bishop Way Unit 3 is a home located in Lake County with nearby schools including Fremont Elementary School, Fremont Intermediate School, and Fremont Jr High/Middle School.
Ownership History
Date
Name
Owned For
Owner Type
Purchase Details
Closed on
Feb 8, 2024
Sold by
Pienta Joseph and Pienta Hisako
Bought by
Hisako Pienta Trust and Joseph W Pienta Trust
Current Estimated Value
Purchase Details
Closed on
Jun 23, 2008
Sold by
Pienta Joseph and Pienta Hisako
Bought by
Pienta Joseph and Pienta Hisako
Home Financials for this Owner
Home Financials are based on the most recent Mortgage that was taken out on this home.
Original Mortgage
$195,000
Interest Rate
5.96%
Mortgage Type
New Conventional
Purchase Details
Closed on
Jun 30, 2003
Sold by
Poll Thomas and Poll Linda M
Bought by
Pienta Jospeh and Pienta Hisako
Home Financials for this Owner
Home Financials are based on the most recent Mortgage that was taken out on this home.
Original Mortgage
$215,000
Interest Rate
5.37%
Mortgage Type
Balloon
Create a Home Valuation Report for This Property
The Home Valuation Report is an in-depth analysis detailing your home's value as well as a comparison with similar homes in the area
Home Values in the Area
Average Home Value in this Area
Purchase History
| Date | Buyer | Sale Price | Title Company |
|---|---|---|---|
| Hisako Pienta Trust | -- | None Listed On Document | |
| Pienta Joseph | -- | First American Title Ins Co | |
| Pienta Jospeh | $314,000 | Multiple |
Source: Public Records
Mortgage History
| Date | Status | Borrower | Loan Amount |
|---|---|---|---|
| Previous Owner | Pienta Joseph | $195,000 | |
| Previous Owner | Pienta Jospeh | $215,000 | |
| Closed | Pienta Jospeh | $56,200 |
Source: Public Records
Tax History Compared to Growth
Tax History
| Year | Tax Paid | Tax Assessment Tax Assessment Total Assessment is a certain percentage of the fair market value that is determined by local assessors to be the total taxable value of land and additions on the property. | Land | Improvement |
|---|---|---|---|---|
| 2024 | $8,499 | $110,646 | $21,049 | $89,597 |
| 2023 | $7,756 | $101,380 | $19,286 | $82,094 |
| 2022 | $7,756 | $90,552 | $18,880 | $71,672 |
| 2021 | $7,409 | $87,380 | $18,219 | $69,161 |
| 2020 | $7,425 | $84,976 | $17,718 | $67,258 |
| 2019 | $7,174 | $82,181 | $17,135 | $65,046 |
| 2018 | $8,100 | $93,031 | $18,064 | $74,967 |
| 2017 | $8,013 | $90,102 | $17,495 | $72,607 |
| 2016 | $7,826 | $85,575 | $16,616 | $68,959 |
| 2015 | $7,679 | $80,224 | $15,577 | $64,647 |
| 2014 | $7,852 | $82,184 | $14,910 | $67,274 |
| 2012 | $7,830 | $82,913 | $15,042 | $67,871 |
Source: Public Records
Map
Nearby Homes
- 1632 Brighton Dr
- 1664 Brighton Dr
- 1730 Savannah Cir
- 191 Springbrook Ct
- 1021 Wrens Gate
- 123 Dunton Ct
- 208 Bingham Cir
- 201 Bingham Cir
- 26220 N Midlothian Rd
- 1349 Spalding Dr
- 1010 Evergreen St Unit 3
- 3174 Comstock Ct
- 1305 Spalding Dr
- 3184 Comstock Ct
- 250 N Fairlawn Ave
- 851 Glenview Ave
- 1520 Trescott St
- 547 N Ridgemoor Ave
- 1300 Kettering Rd
- 973 Highland Rd
- 1821 Bishop Way
- 1821 Bishop Way
- 1809 Bishop Way
- 1826 Victoria Rd
- 561 Westminster Place
- 1818 Victoria Rd
- 1803 Bishop Way
- 1827 Bishop Way
- 1810 Bishop Way
- 1804 Bishop Way
- 555 Westminster Place
- 1812 Victoria Rd Unit 1
- 1816 Bishop Way
- 1740 Bishop Way
- 565 Westminster Place
- 1833 Bishop Way
- 1739 Bishop Way
- 1833 Bishop Way
- 1822 Bishop Way
- 1806 Victoria Rd