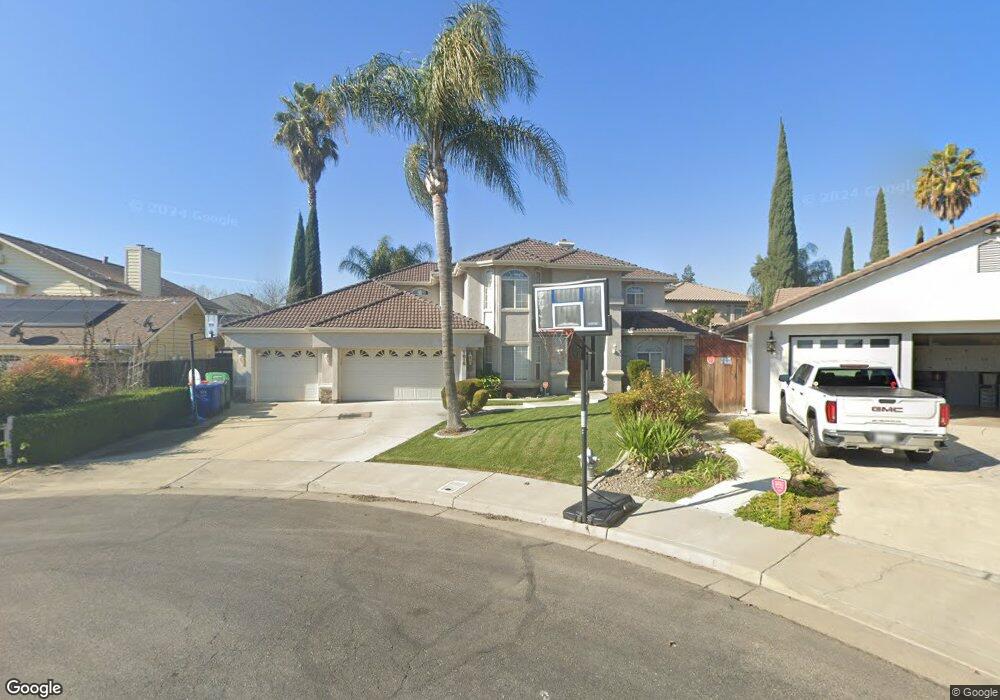
1815 Canyon Ct Los Banos, CA 93635
Estimated Value: $557,000 - $730,000
4
Beds
3
Baths
3,471
Sq Ft
$193/Sq Ft
Est. Value
About This Home
This home is located at 1815 Canyon Ct, Los Banos, CA 93635 and is currently estimated at $670,738, approximately $193 per square foot. 1815 Canyon Ct is a home located in Merced County with nearby schools including Los Banos Elementary School, Creekside Junior High School, and Los Banos High School.
Ownership History
Date
Name
Owned For
Owner Type
Purchase Details
Closed on
May 22, 2020
Sold by
Lowe Perry
Bought by
Lowe Perry
Current Estimated Value
Purchase Details
Closed on
Nov 10, 2015
Sold by
Lowe Patty
Bought by
Lowe Perry
Purchase Details
Closed on
Mar 13, 2003
Sold by
Lowe Perry and Lowe Perry J
Bought by
Lowe Perry and Lowe Patty
Home Financials for this Owner
Home Financials are based on the most recent Mortgage that was taken out on this home.
Original Mortgage
$188,000
Interest Rate
5.82%
Mortgage Type
Purchase Money Mortgage
Create a Home Valuation Report for This Property
The Home Valuation Report is an in-depth analysis detailing your home's value as well as a comparison with similar homes in the area
Home Values in the Area
Average Home Value in this Area
Purchase History
| Date | Buyer | Sale Price | Title Company |
|---|---|---|---|
| Lowe Perry | -- | None Available | |
| Lowe Perry | -- | None Available | |
| Lowe Perry | -- | Fidelity Title Company |
Source: Public Records
Mortgage History
| Date | Status | Borrower | Loan Amount |
|---|---|---|---|
| Closed | Lowe Perry | $188,000 |
Source: Public Records
Tax History Compared to Growth
Tax History
| Year | Tax Paid | Tax Assessment Tax Assessment Total Assessment is a certain percentage of the fair market value that is determined by local assessors to be the total taxable value of land and additions on the property. | Land | Improvement |
|---|---|---|---|---|
| 2025 | $5,852 | $512,053 | $80,606 | $431,447 |
| 2024 | $5,852 | $502,014 | $79,026 | $422,988 |
| 2023 | $5,515 | $492,172 | $77,477 | $414,695 |
| 2022 | $5,416 | $482,522 | $75,958 | $406,564 |
| 2021 | $5,345 | $473,062 | $74,469 | $398,593 |
| 2020 | $5,280 | $468,212 | $73,706 | $394,506 |
| 2019 | $5,183 | $459,032 | $72,261 | $386,771 |
| 2018 | $5,030 | $450,033 | $70,845 | $379,188 |
| 2017 | $4,968 | $441,209 | $69,456 | $371,753 |
| 2016 | $5,022 | $432,559 | $68,095 | $364,464 |
| 2015 | $3,949 | $340,000 | $60,000 | $280,000 |
| 2014 | $4,188 | $364,000 | $30,000 | $334,000 |
Source: Public Records
Map
Nearby Homes