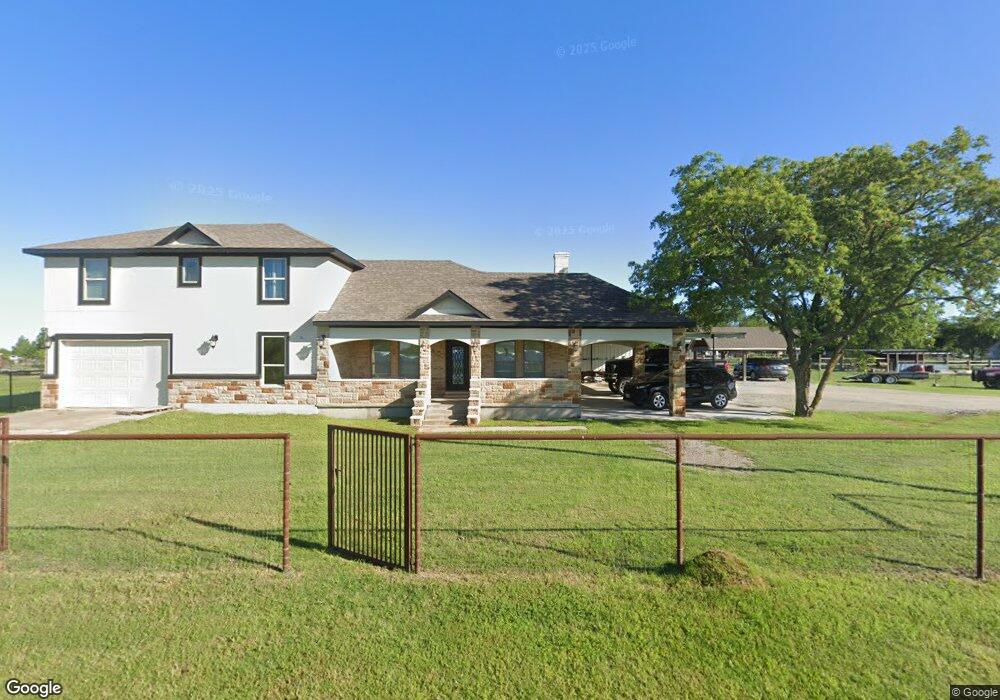
1815 County Road 310a Cleburne, TX 76031
Estimated Value: $293,000 - $611,000
3
Beds
2
Baths
2,988
Sq Ft
$139/Sq Ft
Est. Value
About This Home
This home is located at 1815 County Road 310a, Cleburne, TX 76031 and is currently estimated at $414,123, approximately $138 per square foot. 1815 County Road 310a is a home located in Johnson County with nearby schools including Adams Elementary School, Lowell Smith Jr. Middle School, and Cleburne High School.
Ownership History
Date
Name
Owned For
Owner Type
Purchase Details
Closed on
Feb 25, 2013
Sold by
Nek Inc
Bought by
Garcia Juan Jose and Gonzales Elvira Chavez
Current Estimated Value
Home Financials for this Owner
Home Financials are based on the most recent Mortgage that was taken out on this home.
Original Mortgage
$65,500
Outstanding Balance
$13,387
Interest Rate
3.44%
Mortgage Type
Purchase Money Mortgage
Estimated Equity
$400,736
Purchase Details
Closed on
Jan 1, 2013
Sold by
Long O J
Bought by
Nek Inc
Home Financials for this Owner
Home Financials are based on the most recent Mortgage that was taken out on this home.
Original Mortgage
$65,500
Outstanding Balance
$13,387
Interest Rate
3.44%
Mortgage Type
Purchase Money Mortgage
Estimated Equity
$400,736
Purchase Details
Closed on
Aug 5, 2008
Sold by
York Tommy O and York Ashley
Bought by
Nek Inc
Purchase Details
Closed on
May 3, 2005
Sold by
Long Rexford Lee Caldwell
Bought by
York Tommy O
Create a Home Valuation Report for This Property
The Home Valuation Report is an in-depth analysis detailing your home's value as well as a comparison with similar homes in the area
Home Values in the Area
Average Home Value in this Area
Purchase History
| Date | Buyer | Sale Price | Title Company |
|---|---|---|---|
| Garcia Juan Jose | -- | None Available | |
| Nek Inc | $73,537 | None Available | |
| Nek Inc | -- | None Available | |
| York Tommy O | -- | None Available |
Source: Public Records
Mortgage History
| Date | Status | Borrower | Loan Amount |
|---|---|---|---|
| Open | Garcia Juan Jose | $65,500 | |
| Closed | York Tommy O | $0 |
Source: Public Records
Tax History Compared to Growth
Tax History
| Year | Tax Paid | Tax Assessment Tax Assessment Total Assessment is a certain percentage of the fair market value that is determined by local assessors to be the total taxable value of land and additions on the property. | Land | Improvement |
|---|---|---|---|---|
| 2025 | $3,736 | $186,465 | $64,890 | $121,575 |
| 2024 | $3,736 | $219,918 | $98,343 | $121,575 |
| 2023 | $3,735 | $219,918 | $98,343 | $121,575 |
| 2022 | $3,042 | $158,259 | $36,684 | $121,575 |
| 2021 | $3,131 | $158,259 | $36,684 | $121,575 |
| 2020 | $2,984 | $144,990 | $23,415 | $121,575 |
| 2019 | $3,205 | $144,990 | $23,415 | $121,575 |
| 2018 | $3,207 | $144,990 | $23,415 | $121,575 |
| 2017 | $2,448 | $111,301 | $23,415 | $87,886 |
| 2016 | $1,697 | $77,131 | $23,415 | $53,716 |
| 2015 | $1,482 | $77,131 | $23,415 | $53,716 |
| 2014 | $1,482 | $77,131 | $23,415 | $53,716 |
Source: Public Records
Map
Nearby Homes
- 3048 S Highway 171
- 3309 Apple Ct
- Lot 17 County Road 310
- Lot 11 County Road 310
- 2532 S Highway 171
- 2568 County Road 310
- 1041 County Road 310a
- 2480 County Road 312
- 2656 County Road 314
- 2644 County Road 314
- 2600 County Road 314
- 2628 County Road 314
- 2901 Rolling Oaks Dr
- 3009 Rolling Oaks Dr
- 1014 Highland Rd
- 1013 Highland Rd
- 4421 County Road 1202
- 2860 County Road 312
- 2648 County Road 1107a
- 1031 Spring Azure Dr
- 1817 County Road 310a
- 1821 County Road 310a
- 3333 Pear Ct
- 3325 Pear Ct
- 3216 S Highway 171
- 3208 S Highway 171
- 3309 Pear Ct
- 1637 County Road 310a
- 3120 Texas 171
- 3301 Pear Ct
- 1601 County Road 310a
- 3108 S Highway 171
- 1611 E Plum Ct
- 1611 E Cherry Ct
- 3401 S Highway 171
- 1621 E Cherry Ct
- 3000 S Highway 171
- 3335 Peach Ln
- 1631 E Plum Ct
- 1630 E Plum Ct