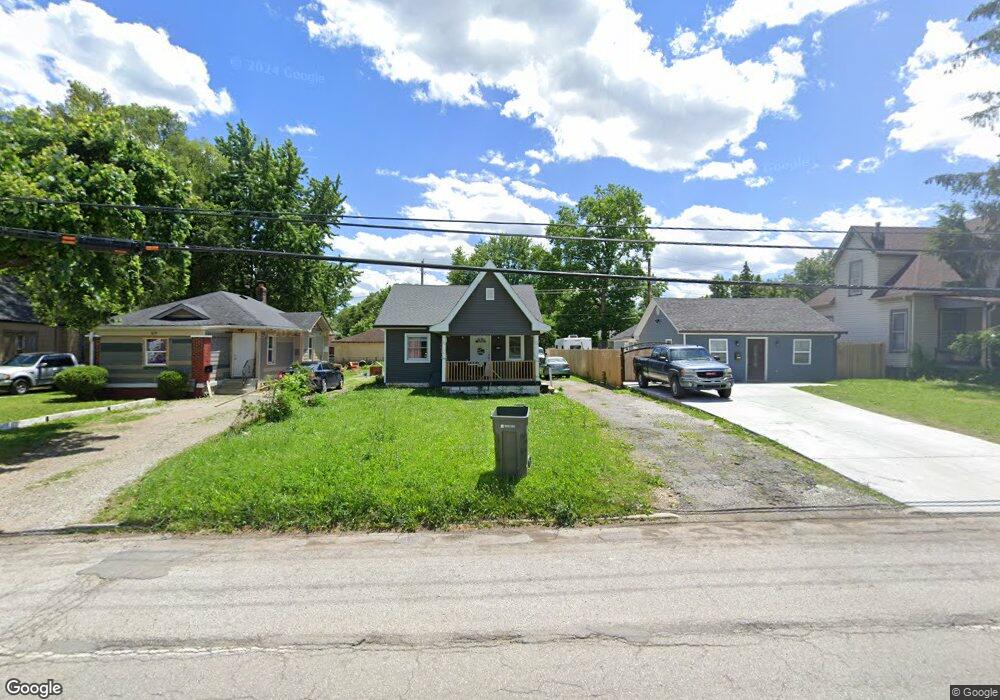
1815 E 34th St Indianapolis, IN 46218
Martindale-Brightwood NeighborhoodEstimated Value: $86,000 - $133,000
2
Beds
1
Bath
1,424
Sq Ft
$71/Sq Ft
Est. Value
About This Home
This home is located at 1815 E 34th St, Indianapolis, IN 46218 and is currently estimated at $100,989, approximately $70 per square foot. 1815 E 34th St is a home located in Marion County with nearby schools including Thomas D. Gregg School No. 15, Washington Irving School 14, and Brookside School 54.
Ownership History
Date
Name
Owned For
Owner Type
Purchase Details
Closed on
Feb 15, 2022
Sold by
Joseph Harrison
Bought by
Arriaza Olvin Noel Ramos
Current Estimated Value
Purchase Details
Closed on
Mar 18, 2021
Sold by
2 For 1 Llc
Bought by
Harrison Joseph
Purchase Details
Closed on
Feb 19, 2021
Sold by
Prazcap Rentals Llc
Bought by
2 For 1 Llc
Purchase Details
Closed on
Feb 3, 2021
Sold by
Prazcap Rentals Llc
Bought by
2 For 1 Llc
Purchase Details
Closed on
Dec 13, 2017
Purchase Details
Closed on
Oct 27, 2017
Purchase Details
Closed on
Jul 25, 2016
Sold by
Mon Ami Realty Llc
Bought by
Mon Ami Ventures Llc and Wabash Developments Llc
Purchase Details
Closed on
Jul 18, 2016
Sold by
Amerruss Property Group Llc
Bought by
Mon Ami Realty Llc
Purchase Details
Closed on
May 30, 2014
Sold by
Randall Daryl
Bought by
Amerruss Property Group Llc
Purchase Details
Closed on
Oct 31, 2013
Sold by
Baptiste Cecelia F and Baptiste Anthony J
Bought by
Randall Daryl
Purchase Details
Closed on
Oct 18, 2013
Sold by
Baptiste Anthony
Bought by
Randall Daryl
Create a Home Valuation Report for This Property
The Home Valuation Report is an in-depth analysis detailing your home's value as well as a comparison with similar homes in the area
Home Values in the Area
Average Home Value in this Area
Purchase History
| Date | Buyer | Sale Price | Title Company |
|---|---|---|---|
| Arriaza Olvin Noel Ramos | -- | None Listed On Document | |
| Harrison Joseph | -- | None Available | |
| 2 For 1 Llc | -- | None Listed On Document | |
| 2 For 1 Llc | $2,000 | None Available | |
| -- | $45,500 | -- | |
| Prazcap Rentals Llc | $45,500 | Monument Title Insurance Compa | |
| -- | $23,400 | -- | |
| Mon Ami Ventures Llc | -- | Mtc | |
| Mon Ami Realty Llc | -- | Mtc | |
| Amerruss Property Group Llc | -- | Mtc | |
| Randall Daryl | -- | -- | |
| Randall Daryl | $20,000 | -- |
Source: Public Records
Tax History
| Year | Tax Paid | Tax Assessment Tax Assessment Total Assessment is a certain percentage of the fair market value that is determined by local assessors to be the total taxable value of land and additions on the property. | Land | Improvement |
|---|---|---|---|---|
| 2025 | $1,412 | $70,800 | $4,600 | $66,200 |
| 2024 | $1,483 | $59,500 | $4,600 | $54,900 |
| 2023 | $1,483 | $58,700 | $4,600 | $54,100 |
| 2022 | $1,456 | $57,900 | $4,600 | $53,300 |
| 2021 | $1,566 | $46,600 | $4,600 | $42,000 |
| 2020 | $1,100 | $43,800 | $2,600 | $41,200 |
| 2019 | $1,049 | $40,900 | $2,600 | $38,300 |
| 2018 | $1,038 | $40,100 | $2,600 | $37,500 |
| 2017 | $1,635 | $38,100 | $2,600 | $35,500 |
| 2016 | $869 | $38,100 | $2,600 | $35,500 |
| 2014 | $923 | $42,500 | $2,600 | $39,900 |
| 2013 | $888 | $42,500 | $2,600 | $39,900 |
Source: Public Records
Map
Nearby Homes
- 1804 E 34th St
- 3514 Orchard Ave
- 3263 Schofield Ave
- 2022 E 34th St
- 3347 Nicholas Ave
- 3244 Nicholas Ave
- 3260 Baltimore Ave
- 3217 Schofield Ave
- 3448 Hillside Ave
- 3425 Hillside Ave
- 3237 N Arsenal Ave
- 3614 Ralston Ave
- 3135 Ralston Ave
- 3412 Brouse Ave
- 2731 Columbia Ave
- 3524 Brouse Ave
- 3114 Hovey St
- 3512 N Keystone Ave
- 3520 N Keystone Ave
- 3258 Winthrop Ave
- 1811 E 34th St
- 1819 E 34th St
- 1823 E 34th St
- 1807 E 34th St
- 3351 Schofield Ave
- 1801 E 34th St
- 1827 E 34th St
- 3345 Schofield Ave
- 3348 Orchard Ave
- 1816 E 34th St
- 1812 E 34th St
- 3342 Orchard Ave
- 1822 E 34th St
- 1808 E 34th St
- 3339 Schofield Ave
- 1743 E 34th St
- 1826 E 34th St
- 3338 Orchard Ave
- 1830 E 34th St
- 1727 E 34th St
Your Personal Tour Guide
Ask me questions while you tour the home.