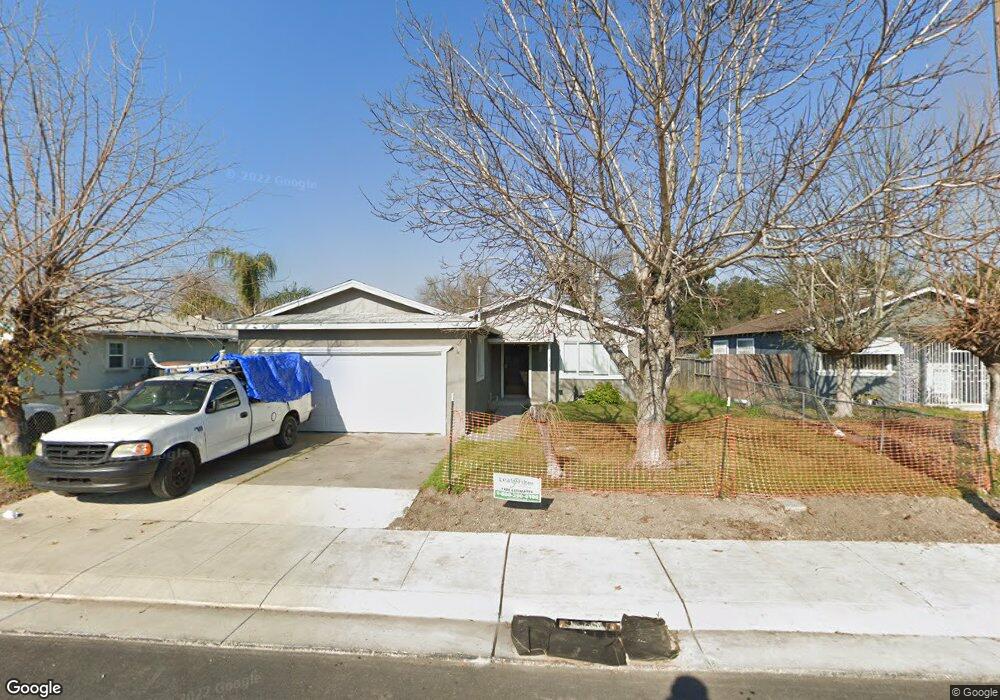
1815 E 9th St Stockton, CA 95206
Kennedy NeighborhoodEstimated Value: $275,000 - $319,852
3
Beds
1
Bath
1,008
Sq Ft
$301/Sq Ft
Est. Value
About This Home
This home is located at 1815 E 9th St, Stockton, CA 95206 and is currently estimated at $303,213, approximately $300 per square foot. 1815 E 9th St is a home located in San Joaquin County with nearby schools including Van Buren Elementary School, Alexander Hamilton Elementary, and Monroe Elementary School.
Ownership History
Date
Name
Owned For
Owner Type
Purchase Details
Closed on
Oct 4, 2021
Sold by
Hernandez Yolanda and Perez Julio
Bought by
Manabat Christopher and Manabat Armida
Current Estimated Value
Home Financials for this Owner
Home Financials are based on the most recent Mortgage that was taken out on this home.
Original Mortgage
$200,000
Outstanding Balance
$182,381
Interest Rate
2.8%
Mortgage Type
New Conventional
Estimated Equity
$120,832
Purchase Details
Closed on
Dec 8, 2015
Sold by
Perez Helen M
Bought by
Perez Julio
Purchase Details
Closed on
Dec 21, 2007
Sold by
Hernandez Julio
Bought by
Hernandez Yolanda
Purchase Details
Closed on
Dec 20, 2007
Sold by
Herrera Charlotte
Bought by
Herrera Charlotte and Hernandez Yolanda
Purchase Details
Closed on
Dec 22, 1994
Sold by
Herrera Joe R
Bought by
Herrera Joe R and Herrera Charlotte
Create a Home Valuation Report for This Property
The Home Valuation Report is an in-depth analysis detailing your home's value as well as a comparison with similar homes in the area
Home Values in the Area
Average Home Value in this Area
Purchase History
| Date | Buyer | Sale Price | Title Company |
|---|---|---|---|
| Manabat Christopher | $250,000 | Placer Title Company | |
| Perez Julio | -- | None Available | |
| Herrera Charlotte | -- | None Available | |
| Hernandez Yolanda | -- | None Available | |
| Herrera Charlotte | -- | None Available | |
| Herrera Joe R | -- | -- |
Source: Public Records
Mortgage History
| Date | Status | Borrower | Loan Amount |
|---|---|---|---|
| Open | Manabat Christopher | $200,000 |
Source: Public Records
Tax History
| Year | Tax Paid | Tax Assessment Tax Assessment Total Assessment is a certain percentage of the fair market value that is determined by local assessors to be the total taxable value of land and additions on the property. | Land | Improvement |
|---|---|---|---|---|
| 2025 | $3,377 | $265,301 | $74,284 | $191,017 |
| 2024 | $3,326 | $260,100 | $72,828 | $187,272 |
| 2023 | $3,352 | $255,000 | $71,400 | $183,600 |
| 2022 | $747 | $40,767 | $3,578 | $37,189 |
| 2021 | $811 | $39,968 | $3,508 | $36,460 |
| 2020 | $641 | $39,560 | $3,473 | $36,087 |
| 2019 | $880 | $38,785 | $3,405 | $35,380 |
| 2018 | $1,201 | $38,026 | $3,339 | $34,687 |
| 2017 | $619 | $37,281 | $3,274 | $34,007 |
| 2016 | $627 | $36,550 | $3,210 | $33,340 |
| 2015 | $625 | $36,001 | $3,162 | $32,839 |
| 2014 | $602 | $35,296 | $3,100 | $32,196 |
Source: Public Records
Map
Nearby Homes
- 2121 Scribner St
- 1553 E 7th St
- 2511 S Laurel St
- 1430 E 7th St
- 1219 E 8th St
- 3011 Anne St
- 1105 E 7th St
- 2319 S Union St
- 2258 E Loomis Rd
- 2278 E Loomis Rd
- 2150 Michael Ave
- 3243 Anne St
- 2291 Amboy Ave
- 1703 Ralph Ave
- 2297 Amboy Ave
- 2318 E Loomis Rd
- 2328 E Loomis Rd
- 3260 Belleview Ave
- 2315 Amboy Ave
- 2348 E Loomis Rd
Your Personal Tour Guide
Ask me questions while you tour the home.