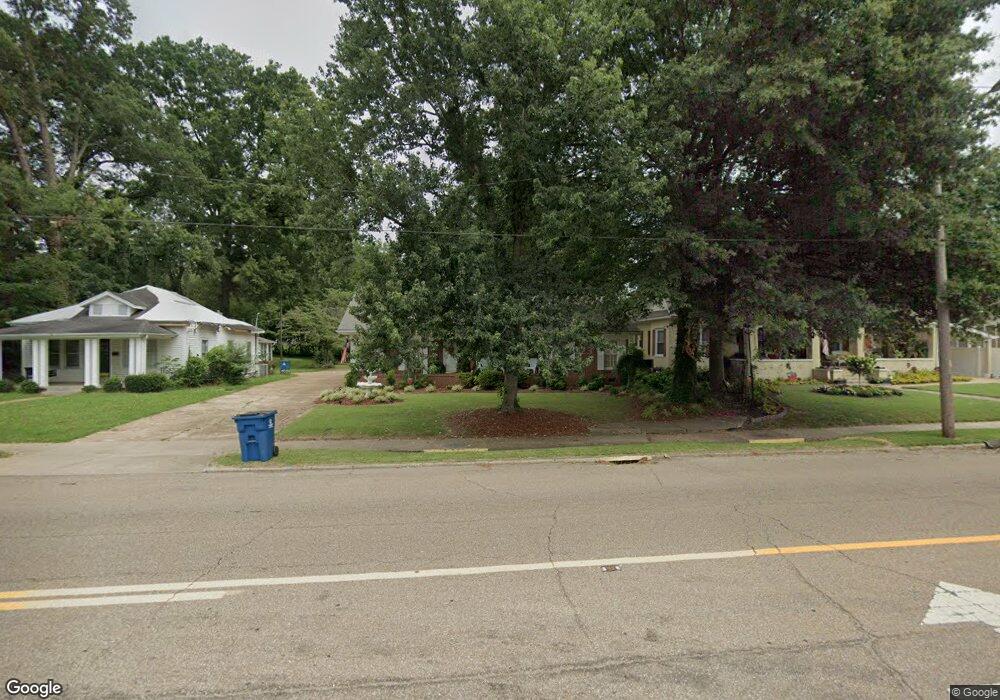
1815 E Main St Humboldt, TN 38343
Estimated Value: $132,000 - $271,000
Studio
3
Baths
2,015
Sq Ft
$89/Sq Ft
Est. Value
About This Home
This home is located at 1815 E Main St, Humboldt, TN 38343 and is currently estimated at $179,751, approximately $89 per square foot. 1815 E Main St is a home located in Gibson County with nearby schools including Stigall Primary School, East Elementary School, and Humboldt Junior/Senior High School.
Ownership History
Date
Name
Owned For
Owner Type
Purchase Details
Closed on
Mar 7, 2007
Sold by
Denton Michelle E Etvir
Bought by
Denton Michelle E
Current Estimated Value
Purchase Details
Closed on
Jun 4, 2004
Sold by
Denton Michelle
Bought by
Denton Floyd Randy
Home Financials for this Owner
Home Financials are based on the most recent Mortgage that was taken out on this home.
Original Mortgage
$88,000
Interest Rate
5.98%
Purchase Details
Closed on
May 20, 1999
Sold by
Hadley Faith G
Bought by
Fonville Michelle E
Home Financials for this Owner
Home Financials are based on the most recent Mortgage that was taken out on this home.
Original Mortgage
$89,366
Interest Rate
6.84%
Purchase Details
Closed on
Aug 17, 1996
Sold by
Stalling Ben C Dds
Bought by
Hadley Faith
Purchase Details
Closed on
May 22, 1989
Bought by
Stalling Ben C Dds and Stalling Latricia
Purchase Details
Closed on
Dec 6, 1958
Bought by
Oliver Weldon Frances
Create a Home Valuation Report for This Property
The Home Valuation Report is an in-depth analysis detailing your home's value as well as a comparison with similar homes in the area
Home Values in the Area
Average Home Value in this Area
Purchase History
| Date | Buyer | Sale Price | Title Company |
|---|---|---|---|
| Denton Michelle E | -- | -- | |
| Denton Floyd Randy | -- | -- | |
| Fonville Michelle E | $93,000 | -- | |
| Hadley Faith | $72,000 | -- | |
| Stalling Ben C Dds | $44,000 | -- | |
| Oliver Weldon Frances | -- | -- |
Source: Public Records
Mortgage History
| Date | Status | Borrower | Loan Amount |
|---|---|---|---|
| Previous Owner | Oliver Weldon Frances | $88,000 | |
| Previous Owner | Oliver Weldon Frances | $89,366 |
Source: Public Records
Tax History
| Year | Tax Paid | Tax Assessment Tax Assessment Total Assessment is a certain percentage of the fair market value that is determined by local assessors to be the total taxable value of land and additions on the property. | Land | Improvement |
|---|---|---|---|---|
| 2025 | $1,011 | $37,325 | $3,500 | $33,825 |
| 2024 | $1,011 | $37,325 | $3,500 | $33,825 |
| 2023 | $262 | $23,750 | $2,250 | $21,500 |
| 2022 | $245 | $23,750 | $2,250 | $21,500 |
| 2021 | $245 | $23,750 | $2,250 | $21,500 |
| 2020 | $893 | $23,750 | $2,250 | $21,500 |
| 2019 | $893 | $23,750 | $2,250 | $21,500 |
| 2018 | $930 | $22,925 | $2,250 | $20,675 |
| 2017 | $906 | $22,600 | $2,250 | $20,350 |
| 2016 | $906 | $22,600 | $2,250 | $20,350 |
| 2015 | $898 | $22,600 | $2,250 | $20,350 |
| 2014 | $898 | $22,600 | $2,250 | $20,350 |
Source: Public Records
Map
Nearby Homes
- 403 N 18th Ave
- 1635 Osborne St
- 2012 E Mitchell St
- 1907 E Mitchell St
- 700 N 18th Ave
- 704 N 17th Ave
- 716 N 18th Ave
- 812 N Central Ave
- 2425 St Mary Dr
- 803 N 25th Ave
- 1622 Brown St Unit 1624
- 2606 Northwood Blvd
- 2502 Lalatta Ln
- 1310 N Central Ave
- 2003 Campbell St
- 510 Penn St
- 78 Etheridge St
- 2016 Elliott St
- 1436 N 18th Ave
- 917 N 12th Ave
- 1811 E Main St
- 1821 E Main St
- 1827 E Main St
- 1803 E Main St
- 1816 Osborne St
- 1820 Osborne St
- 1808 Osborne St
- 1835 E Main St
- 113 N 19th Ave
- 1814 E Main St
- 202 N 18th Ave
- 203 N 19th Ave
- 1822 E Main St
- 1840 Osborne St
- 1824 Osborne St
- 1828 Osborne St
- 1826 E Main St
- 1802 Osborne St
- 1806 E Main St
- 207 N 19th Ave
Your Personal Tour Guide
Ask me questions while you tour the home.