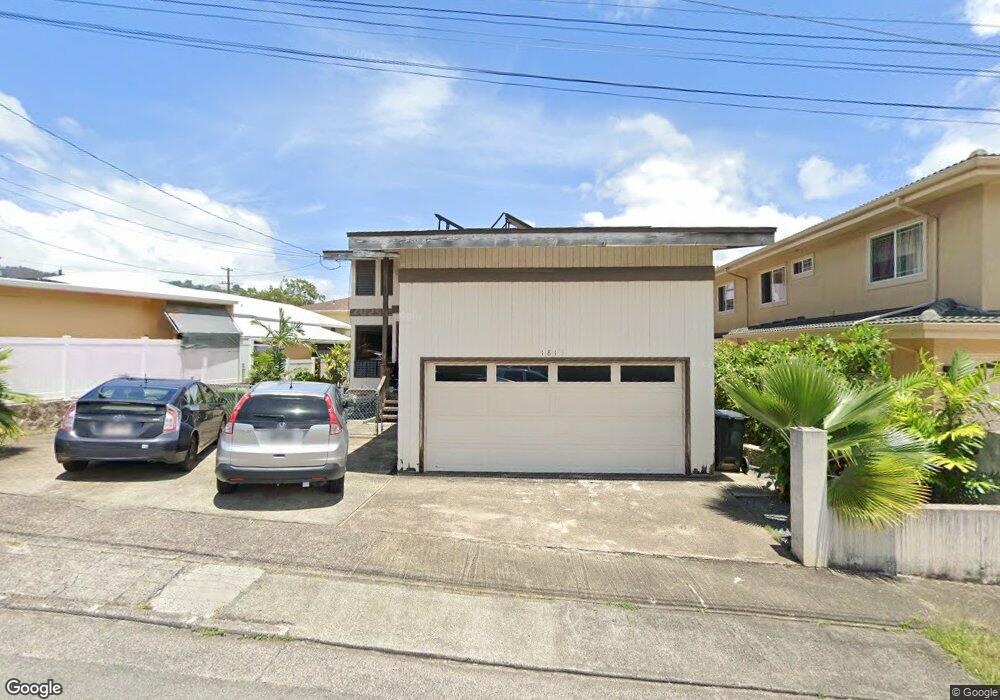
1815 Kilohi St Honolulu, HI 96819
Kalihi Valley NeighborhoodEstimated Value: $1,072,000 - $1,474,000
4
Beds
3
Baths
2,224
Sq Ft
$565/Sq Ft
Est. Value
About This Home
This home is located at 1815 Kilohi St, Honolulu, HI 96819 and is currently estimated at $1,255,506, approximately $564 per square foot. 1815 Kilohi St is a home located in Honolulu County with nearby schools including Ka'ewai Elementary School, Governor Sanford B Dole Middle School, and Gov. Wallace Rider Farrington High School.
Ownership History
Date
Name
Owned For
Owner Type
Purchase Details
Closed on
Oct 14, 2017
Sold by
Sadoyama Yasuo and Sadoyama Chiyo
Bought by
Sadoyama Eric Jun and Sadoyama Judy Kimie
Current Estimated Value
Purchase Details
Closed on
Sep 24, 2001
Sold by
Sadoyama Eric Jun and Sadoyama Judy Kimie
Bought by
Sadoyama Eric Jun and Sadoyama Judy Kimie
Purchase Details
Closed on
May 27, 1997
Sold by
Fu Robert Hong Yee and Fu Sharon Yuk Moi
Bought by
Sadoyama Eric Jun and Sadoyama Judy Kimie
Home Financials for this Owner
Home Financials are based on the most recent Mortgage that was taken out on this home.
Original Mortgage
$304,000
Interest Rate
8.13%
Purchase Details
Closed on
Apr 25, 1997
Sold by
Fu Robert Kwai Yuen and Fu Robert K Y
Bought by
Fu Robert Kwai Yuen and Fu Robert K Y
Home Financials for this Owner
Home Financials are based on the most recent Mortgage that was taken out on this home.
Original Mortgage
$304,000
Interest Rate
8.13%
Create a Home Valuation Report for This Property
The Home Valuation Report is an in-depth analysis detailing your home's value as well as a comparison with similar homes in the area
Home Values in the Area
Average Home Value in this Area
Purchase History
| Date | Buyer | Sale Price | Title Company |
|---|---|---|---|
| Sadoyama Eric Jun | -- | None Available | |
| Sadoyama Eric Jun | -- | None Available | |
| Sadoyama Eric Jun | -- | -- | |
| Sadoyama Eric Jun | $380,000 | -- | |
| Fu Robert Kwai Yuen | -- | -- |
Source: Public Records
Mortgage History
| Date | Status | Borrower | Loan Amount |
|---|---|---|---|
| Closed | Sadoyama Eric Jun | $304,000 |
Source: Public Records
Tax History Compared to Growth
Tax History
| Year | Tax Paid | Tax Assessment Tax Assessment Total Assessment is a certain percentage of the fair market value that is determined by local assessors to be the total taxable value of land and additions on the property. | Land | Improvement |
|---|---|---|---|---|
| 2025 | $3,994 | $1,295,300 | $917,900 | $377,400 |
| 2024 | $3,994 | $1,261,100 | $917,900 | $343,200 |
| 2023 | $3,573 | $1,220,800 | $938,300 | $282,500 |
| 2022 | $3,581 | $1,123,000 | $754,700 | $368,300 |
| 2021 | $3,141 | $997,300 | $734,300 | $263,000 |
| 2020 | $3,183 | $1,009,400 | $754,700 | $254,700 |
| 2019 | $3,459 | $1,068,400 | $775,100 | $293,300 |
| 2018 | $2,892 | $906,200 | $632,300 | $273,900 |
| 2017 | $2,934 | $918,300 | $591,500 | $326,800 |
| 2016 | $2,714 | $855,500 | $581,300 | $274,200 |
| 2015 | $2,300 | $737,200 | $530,300 | $206,900 |
| 2014 | $2,420 | $746,800 | $469,100 | $277,700 |
Source: Public Records
Map
Nearby Homes
- 2307 N School St Unit A
- 1736 Gulick Ave
- 1526 Amelia St
- 2123 Wilson St
- 2548 N School St
- 2318 Rose St
- 1709 Perry St
- 2202 Wilson St
- 1570 Ohu St
- 1915 Lohilani St Unit B
- 1592 Perry St
- 1260 Richard Ln Unit 406
- 1247 Gulick Ave
- 1142 Richard Ln
- 2871-F Kalihi St
- 1445 Monte Cooke Place
- 1926 Hani Ln Unit A
- 1425 Monte Cooke Place
- 1561 Ahihi St
- 1581 Murphy St
- 1821 Kilohi St
- 1807 Kilohi St
- 1818 Kamehameha IV Rd
- 1801 Kilohi St
- 1822 Kamehameha IV Rd
- 1812 Kamehameha IV Rd
- 2419 Hihio Place
- 2413 Hihio Place
- 1816 Kilohi St
- 1810 Kilohi St
- 1804 Kamehameha IV Rd
- 1828 Kamehameha IV Rd
- 1822 Kilohi St
- 1749 Kilohi St
- 1752 Kilohi St
- 2433 Hihio Place
- 2444 Kawohi Place
- 1756 Kamehameha IV Rd
- 1756 Kamehameha IV Rd Unit A
- 2437 Kawohi Place