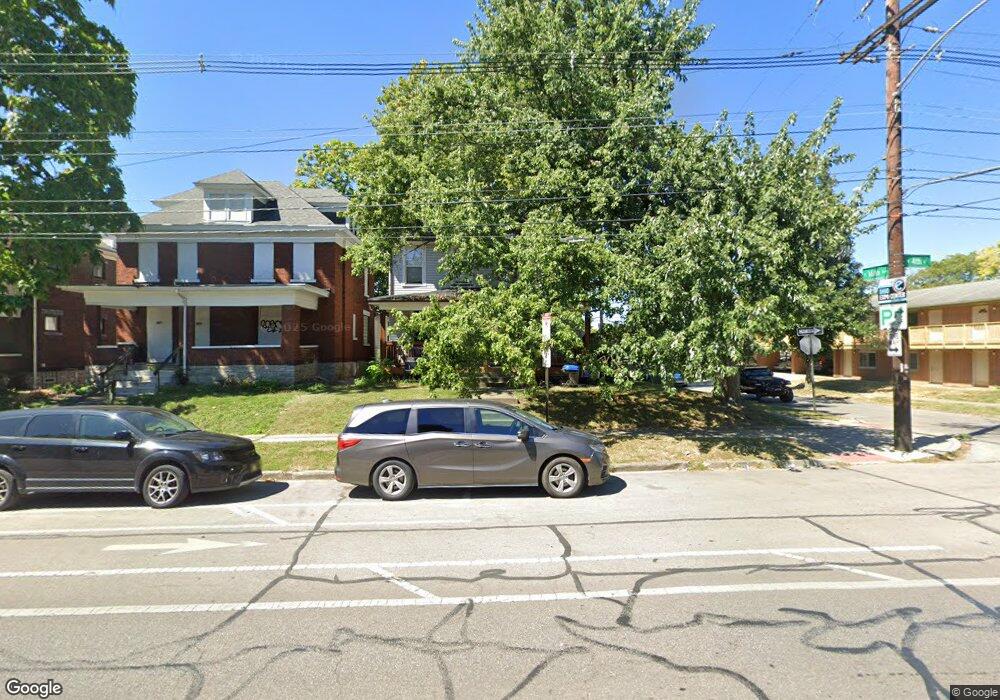
1815 N 4th St Columbus, OH 43201
Indianola Terrace NeighborhoodEstimated Value: $520,387
4
Beds
4
Baths
3,079
Sq Ft
$169/Sq Ft
Est. Value
About This Home
This home is located at 1815 N 4th St, Columbus, OH 43201 and is currently estimated at $520,387, approximately $169 per square foot. 1815 N 4th St is a home located in Franklin County with nearby schools including Weinland Park Elementary School, Dominion Middle School, and Whetstone High School.
Ownership History
Date
Name
Owned For
Owner Type
Purchase Details
Closed on
May 3, 2019
Sold by
Oh Cal Properties Lc
Bought by
Baker Brian Thomas and Baker Melissa Maxwell
Current Estimated Value
Home Financials for this Owner
Home Financials are based on the most recent Mortgage that was taken out on this home.
Original Mortgage
$266,813
Outstanding Balance
$231,635
Interest Rate
4%
Mortgage Type
New Conventional
Estimated Equity
$288,752
Purchase Details
Closed on
Apr 9, 2010
Sold by
Kelley Daniel and Kelley Elizabeth
Bought by
Oh Cal Properties Llc
Home Financials for this Owner
Home Financials are based on the most recent Mortgage that was taken out on this home.
Original Mortgage
$115,200
Interest Rate
5.1%
Mortgage Type
Future Advance Clause Open End Mortgage
Purchase Details
Closed on
Oct 10, 2006
Sold by
Anderson Malinda R and Anderson Richard H
Bought by
Kelley Daniel and Kelley Elizabeth
Home Financials for this Owner
Home Financials are based on the most recent Mortgage that was taken out on this home.
Original Mortgage
$107,900
Interest Rate
6.5%
Mortgage Type
Commercial
Purchase Details
Closed on
Mar 1, 1980
Create a Home Valuation Report for This Property
The Home Valuation Report is an in-depth analysis detailing your home's value as well as a comparison with similar homes in the area
Home Values in the Area
Average Home Value in this Area
Purchase History
We collect this data history from publicly available records. To have your information removed, we recommend requesting removal directly through your county’s website.
| Date | Buyer | Sale Price | Title Company |
|---|---|---|---|
| Baker Brian Thomas | $355,800 | Amerititle Box | |
| Oh Cal Properties Llc | $144,000 | Amerititle | |
| Kelley Daniel | $119,900 | Independent | |
| -- | $42,000 | -- |
Source: Public Records
Mortgage History
We collect this data history from publicly available records. To have your information removed, we recommend requesting removal directly through your county’s website.
| Date | Status | Borrower | Loan Amount |
|---|---|---|---|
| Open | Baker Brian Thomas | $266,813 | |
| Previous Owner | Oh Cal Properties Llc | $115,200 | |
| Previous Owner | Kelley Daniel | $107,900 |
Source: Public Records
Tax History
| Year | Tax Paid | Tax Assessment Tax Assessment Total Assessment is a certain percentage of the fair market value that is determined by local assessors to be the total taxable value of land and additions on the property. | Land | Improvement |
|---|---|---|---|---|
| 2025 | $5,003 | $67,410 | $17,850 | $49,560 |
| 2024 | $5,003 | $67,410 | $17,850 | $49,560 |
| 2023 | $4,924 | $67,410 | $17,850 | $49,560 |
| 2022 | $8,814 | $117,530 | $10,430 | $107,100 |
| 2021 | $8,852 | $117,530 | $10,430 | $107,100 |
| 2020 | $8,791 | $117,530 | $10,430 | $107,100 |
| 2019 | $5,189 | $63,000 | $10,430 | $52,570 |
| 2018 | $5,527 | $63,000 | $10,430 | $52,570 |
| 2017 | $5,759 | $63,000 | $10,430 | $52,570 |
| 2016 | $6,335 | $72,800 | $10,430 | $62,370 |
| 2015 | $5,882 | $72,800 | $10,430 | $62,370 |
| 2014 | $5,879 | $72,800 | $10,430 | $62,370 |
| 2013 | $2,913 | $72,800 | $10,430 | $62,370 |
Source: Public Records
Map
Nearby Homes
- 387 E 17th Ave
- 384 E 17th Ave
- 288 E 14th Ave
- 1777 Summit St
- 445 E 16th Ave
- 357 E 14th Ave
- 408 E 14th Ave
- 407 E 13th Ave Unit 405
- 411-415 E 13th Ave
- 433 E 13th Ave
- 347 E 12th Ave
- 174 E 12th Ave
- 2103 Iuka Ave
- 100 Chittenden Ave
- 65 E 18th Ave
- 300-310 E 9th Ave
- 1471 N 6th St
- 1476 N 6th St
- 1457 N 5th St
- 333 E 9th Ave
- 1815 N 4th St Unit 17
- 1807 N 4th St Unit 809
- 323 E 16th Ave Unit 325
- 323-325 E 16th Ave
- 1803 N 4th St
- 1803 N 4th St Unit 1801
- 1801 N 4th St Unit 803
- 1801 N 4th St
- 1827 N 4th St
- 1797 N 4th St
- 315 E 16th Ave Unit 317
- 1833 N 4th St Unit 835
- 1793 1/2 N 4th St
- 1793 N 4th St Unit 1
- 1837 N 4th St Unit 839
- 1789 N 4th St
- 318 E 16th Ave Unit 320
- 1806 N 4th St
- 312 E 16th Ave
- 1843-1847-1847 N 4th St Unit 1847
Your Personal Tour Guide
Ask me questions while you tour the home.