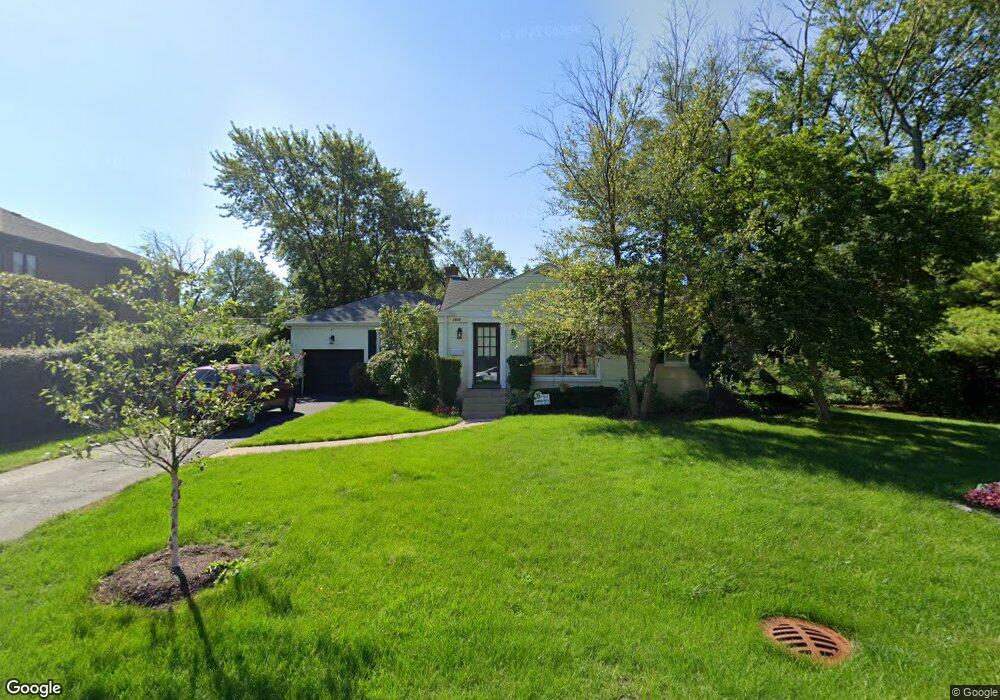
1815 N Robincrest Ln Glenview, IL 60025
Estimated Value: $579,698 - $669,000
3
Beds
2
Baths
1,217
Sq Ft
$505/Sq Ft
Est. Value
About This Home
This home is located at 1815 N Robincrest Ln, Glenview, IL 60025 and is currently estimated at $615,175, approximately $505 per square foot. 1815 N Robincrest Ln is a home located in Cook County with nearby schools including Hoffman Elementary School, Henking Elementary School, and Springman Middle School.
Ownership History
Date
Name
Owned For
Owner Type
Purchase Details
Closed on
Jul 30, 2001
Sold by
Baxter Brian C and Baxter Susan K
Bought by
Garza Bascaran Jose and Garza Debascaran Lucia
Current Estimated Value
Home Financials for this Owner
Home Financials are based on the most recent Mortgage that was taken out on this home.
Original Mortgage
$266,000
Outstanding Balance
$103,687
Interest Rate
7.14%
Estimated Equity
$511,488
Purchase Details
Closed on
Oct 4, 1994
Sold by
American National Bk & Tr Co Of Chicago
Bought by
Baxter Brian C and Baxter Susan K
Home Financials for this Owner
Home Financials are based on the most recent Mortgage that was taken out on this home.
Original Mortgage
$172,900
Interest Rate
8.55%
Create a Home Valuation Report for This Property
The Home Valuation Report is an in-depth analysis detailing your home's value as well as a comparison with similar homes in the area
Home Values in the Area
Average Home Value in this Area
Purchase History
| Date | Buyer | Sale Price | Title Company |
|---|---|---|---|
| Garza Bascaran Jose | $332,500 | Chicago Title Insurance Co | |
| Baxter Brian C | $182,000 | -- |
Source: Public Records
Mortgage History
| Date | Status | Borrower | Loan Amount |
|---|---|---|---|
| Open | Garza Bascaran Jose | $266,000 | |
| Previous Owner | Baxter Brian C | $172,900 |
Source: Public Records
Tax History Compared to Growth
Tax History
| Year | Tax Paid | Tax Assessment Tax Assessment Total Assessment is a certain percentage of the fair market value that is determined by local assessors to be the total taxable value of land and additions on the property. | Land | Improvement |
|---|---|---|---|---|
| 2024 | $7,992 | $39,425 | $16,568 | $22,857 |
| 2023 | $7,744 | $39,425 | $16,568 | $22,857 |
| 2022 | $7,744 | $39,425 | $16,568 | $22,857 |
| 2021 | $6,945 | $31,233 | $12,684 | $18,549 |
| 2020 | $7,108 | $31,233 | $12,684 | $18,549 |
| 2019 | $6,645 | $34,322 | $12,684 | $21,638 |
| 2018 | $6,713 | $31,771 | $11,131 | $20,640 |
| 2017 | $6,553 | $31,771 | $11,131 | $20,640 |
| 2016 | $6,397 | $31,771 | $11,131 | $20,640 |
| 2015 | $6,436 | $28,625 | $9,060 | $19,565 |
| 2014 | $6,339 | $28,625 | $9,060 | $19,565 |
| 2013 | $6,137 | $28,625 | $9,060 | $19,565 |
Source: Public Records
Map
Nearby Homes
- 1821 George Ct
- 609 Carriage Hill Dr
- 601 Carriage Hill Dr
- 711 Carriage Hill Dr
- 713 Carriage Hill Dr
- 1800 Dewes St Unit 305
- 1800 Dewes St Unit 201
- 245 Nora Ave
- 315 Lincoln St
- 1123 Longvalley Rd
- 1121 Longvalley Rd
- 517 Briarhill Ln
- 2137 Glenview Rd
- 1220 Depot St Unit 305
- 1220 Depot St Unit 109
- 1220 Depot St Unit 409
- 1752 Maclean Ct
- 1125 Longvalley Rd
- 1341 Greenwillow Ln Unit C
- 7324 Palma Ln
- 1785 N Robincrest Ln
- 1812 S Robincrest Ln
- 1804 S Robincrest Ln
- 1783 N Robincrest Ln
- 1808 N Robincrest Ln
- 1814 N Robincrest Ln
- 1826 N Robincrest Ln
- 1822 N Robincrest Ln
- 1800 S Robincrest Ln
- 1820 N Robincrest Ln
- 1825 S Robincrest Ln
- 1802 N Robincrest Ln
- 1775 N Robincrest Ln
- 1811 S Robincrest Ln
- 1833 N Robincrest Ln
- 1836 N Robincrest Ln
- 1774 S Robincrest Ln
- 1817 S Robincrest Ln
- 1805 S Robincrest Ln
- 1819 S Robincrest Ln