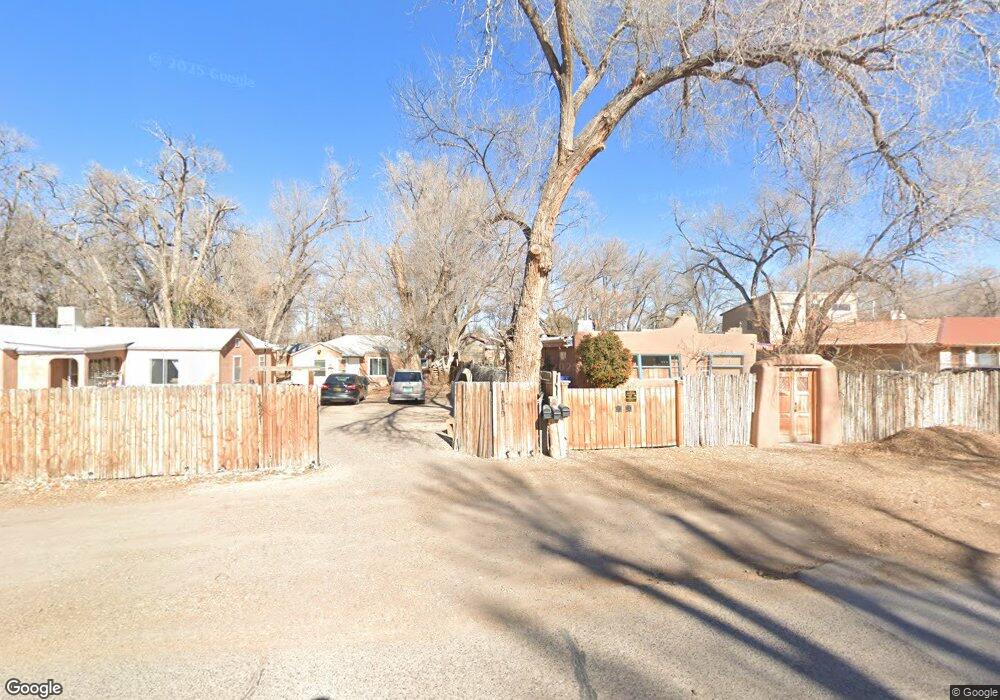
1815 Poplar Ln SW Albuquerque, NM 87105
Estimated Value: $229,000 - $391,000
2
Beds
1
Bath
1,180
Sq Ft
$246/Sq Ft
Est. Value
About This Home
This home is located at 1815 Poplar Ln SW, Albuquerque, NM 87105 and is currently estimated at $289,883, approximately $245 per square foot. 1815 Poplar Ln SW is a home located in Bernalillo County with nearby schools including Valle Vista Elementary School, Ernie Pyle Middle School, and Rio Grande High School.
Ownership History
Date
Name
Owned For
Owner Type
Purchase Details
Closed on
Jul 3, 2024
Sold by
Schneider Michael Joseph and Webb Barbara Allyson
Bought by
Michael Joseph Schneider And Barbara Allyson
Current Estimated Value
Purchase Details
Closed on
Apr 8, 2020
Sold by
Tomasi Anne M
Bought by
Schneider Michael J and Webb Barbara
Home Financials for this Owner
Home Financials are based on the most recent Mortgage that was taken out on this home.
Original Mortgage
$188,800
Interest Rate
3.4%
Mortgage Type
New Conventional
Purchase Details
Closed on
May 21, 2014
Sold by
Hoover David J
Bought by
Sublett Leslie M and Sublett Urva S
Purchase Details
Closed on
Oct 25, 2013
Sold by
Sublett Urva S and Sublett Sandra
Bought by
Sublett Urva S and Sublett Leslie M
Purchase Details
Closed on
Apr 11, 2012
Sold by
Sublett Leslie M
Bought by
Sublett Urva S
Purchase Details
Closed on
Nov 26, 2004
Sold by
Jones Amy L
Bought by
Bolas Martin L
Create a Home Valuation Report for This Property
The Home Valuation Report is an in-depth analysis detailing your home's value as well as a comparison with similar homes in the area
Home Values in the Area
Average Home Value in this Area
Purchase History
| Date | Buyer | Sale Price | Title Company |
|---|---|---|---|
| Michael Joseph Schneider And Barbara Allyson | -- | None Listed On Document | |
| Schneider Michael J | -- | First American Title Ins Co | |
| Sublett Leslie M | -- | None Available | |
| Sublett Urva S | -- | None Available | |
| Sublett Urva S | -- | None Available | |
| Bolas Martin L | -- | -- |
Source: Public Records
Mortgage History
| Date | Status | Borrower | Loan Amount |
|---|---|---|---|
| Previous Owner | Schneider Michael J | $188,800 |
Source: Public Records
Tax History Compared to Growth
Tax History
| Year | Tax Paid | Tax Assessment Tax Assessment Total Assessment is a certain percentage of the fair market value that is determined by local assessors to be the total taxable value of land and additions on the property. | Land | Improvement |
|---|---|---|---|---|
| 2024 | $2,683 | $72,299 | $12,702 | $59,597 |
| 2023 | $2,635 | $70,193 | $12,332 | $57,861 |
| 2022 | $2,496 | $68,593 | $12,332 | $56,261 |
| 2021 | $2,490 | $68,693 | $12,332 | $56,361 |
| 2020 | $1,592 | $43,410 | $13,475 | $29,935 |
| 2019 | $1,397 | $38,117 | $13,083 | $25,034 |
| 2018 | $1,349 | $38,117 | $13,083 | $25,034 |
| 2017 | $1,298 | $37,008 | $12,702 | $24,306 |
| 2016 | $1,397 | $38,983 | $11,231 | $27,752 |
| 2015 | $37,848 | $37,848 | $10,904 | $26,944 |
| 2014 | $1,292 | $36,746 | $10,587 | $26,159 |
| 2013 | -- | $35,675 | $10,278 | $25,397 |
Source: Public Records
Map
Nearby Homes
- 1911 Poplar Ln SW
- 1101 Pear Dr SW
- 1545 Feliz Ln SW
- 1736 Garden Way SW
- 1740 Garden Way SW
- 1816 San Ygnacio Rd SW
- 1723 Garden Way SW
- 512 Twilight Vista Ln SW
- 1567 Las Glorietas SW
- 2234 Hooper Rd SW
- 501 Whitten Trail SW
- 1211 Presidio Place SW
- 721 Foothill Dr SW Unit A
- 1829 Mae Ave SW
- 1347 Young Ave SW
- 425 Sunset Rd SW
- 5301 Los Abuelos Ct SW
- 1109 Lovato Rd SW
- 5308 White Reserve Ave SW
- 714 City View Dr SW
- 1809 Poplar Ln SW
- 1821 Poplar Ln SW
- 1825 Poplar Ln SW
- 1803 Poplar Ln SW
- 1814 Poplar Ln SW
- 1801 Poplar Ln SW
- 1908 Lena Rd SW
- 1716 Lena Rd SW
- 1818 Poplar Ln SW
- 1812 Poplar Ln SW
- 1708 Lena Rd SW
- 1818 Lena Rd SW
- 1704 Lena Dr SW
- 1910 Lena Rd SW
- 1711 Poplar Ln SW
- 805 Goff Blvd SW
- 1929 Poplar Ln SW
- 1828 Poplar Ln SW
- 809 Goff Blvd SW
- 1806 Poplar Ln SW