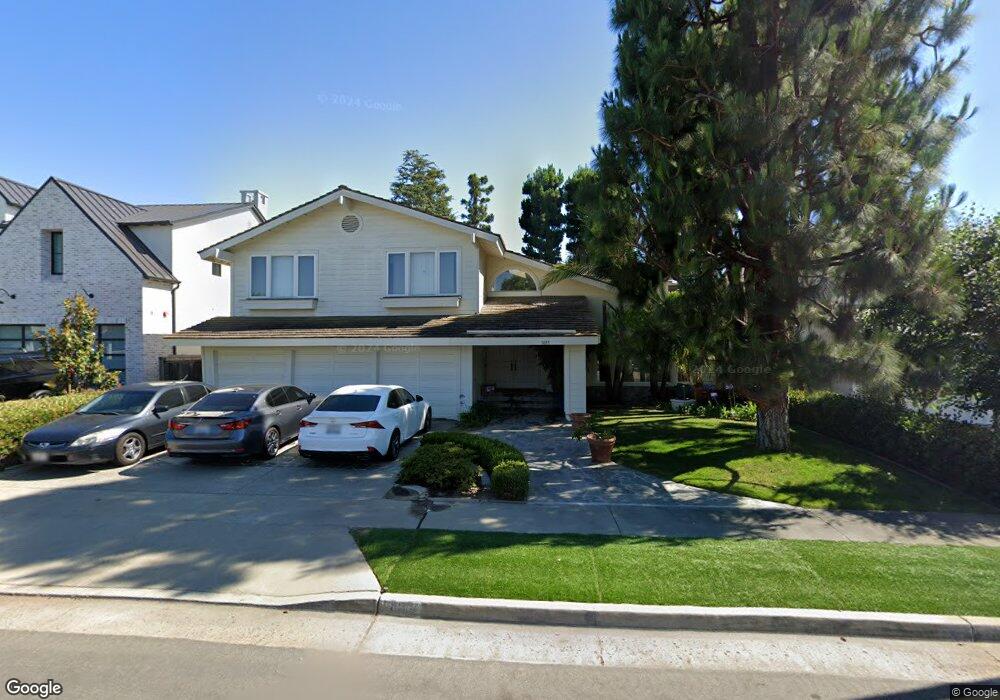
1815 Port Abbey Place Newport Beach, CA 92660
Harbor View Homes NeighborhoodEstimated Value: $3,962,000 - $5,767,000
5
Beds
3
Baths
3,673
Sq Ft
$1,274/Sq Ft
Est. Value
About This Home
This home is located at 1815 Port Abbey Place, Newport Beach, CA 92660 and is currently estimated at $4,678,978, approximately $1,273 per square foot. 1815 Port Abbey Place is a home located in Orange County with nearby schools including Roy O. Andersen Elementary School, Corona del Mar Middle and High School, and Newport Christian School.
Ownership History
Date
Name
Owned For
Owner Type
Purchase Details
Closed on
Mar 26, 1993
Sold by
Peters George A and Peters Anne
Bought by
Su Henry C and Chen Ming Fuang
Current Estimated Value
Home Financials for this Owner
Home Financials are based on the most recent Mortgage that was taken out on this home.
Original Mortgage
$420,000
Interest Rate
7.74%
Mortgage Type
Construction
Create a Home Valuation Report for This Property
The Home Valuation Report is an in-depth analysis detailing your home's value as well as a comparison with similar homes in the area
Home Values in the Area
Average Home Value in this Area
Purchase History
| Date | Buyer | Sale Price | Title Company |
|---|---|---|---|
| Su Henry C | $560,000 | Fidelity National Title Ins |
Source: Public Records
Mortgage History
| Date | Status | Borrower | Loan Amount |
|---|---|---|---|
| Closed | Su Henry C | $420,000 |
Source: Public Records
Tax History Compared to Growth
Tax History
| Year | Tax Paid | Tax Assessment Tax Assessment Total Assessment is a certain percentage of the fair market value that is determined by local assessors to be the total taxable value of land and additions on the property. | Land | Improvement |
|---|---|---|---|---|
| 2025 | $11,356 | $1,069,864 | $767,500 | $302,364 |
| 2024 | $11,356 | $1,048,887 | $752,451 | $296,436 |
| 2023 | $11,087 | $1,028,321 | $737,697 | $290,624 |
| 2022 | $10,899 | $1,008,158 | $723,232 | $284,926 |
| 2021 | $10,690 | $988,391 | $709,051 | $279,340 |
| 2020 | $10,586 | $978,257 | $701,781 | $276,476 |
| 2019 | $10,370 | $959,076 | $688,021 | $271,055 |
| 2018 | $10,163 | $940,271 | $674,530 | $265,741 |
| 2017 | $9,983 | $921,835 | $661,304 | $260,531 |
| 2016 | $9,759 | $903,760 | $648,337 | $255,423 |
| 2015 | $9,665 | $890,185 | $638,598 | $251,587 |
| 2014 | $9,436 | $872,748 | $626,089 | $246,659 |
Source: Public Records
Map
Nearby Homes
- 1812 Port Margate Place
- 1736 Port Sheffield Place
- 1845 Port Westbourne Place
- 58 Victoria
- 1977 Port Cardiff Place
- 15 Boardwalk
- 515 Bay Hill Dr
- 10 Seabluff
- 2 Royal Saint George Rd
- 4 Huntington Ct
- 29 Augusta Ln
- 49 Canyon Island Dr
- 51 Sea Pine Ln Unit 59
- 56 Royal Saint George Rd
- 15 Cypress Point Ln
- 17 Monaco Unit 12
- 5 Hillsborough
- 2703 Hillside Dr Unit 36
- 1 Cypress Point Ln
- 23 Lochmoor Ln
- 1807 Port Abbey Place
- 1821 Port Abbey Place
- 1829 Port Abbey Place
- 1801 Port Abbey Place
- 1824 Port Margate Place
- 1806 Port Margate Place
- 1806 Port Abbey Place
- 1812 Port Abbey Place
- 1830 Port Margate Place
- 1835 Port Abbey Place
- 1800 Port Abbey Place
- 1818 Port Abbey Place
- 1800 Port Margate Place
- 1824 Port Abbey Place
- 1836 Port Margate Place
- 1841 Port Abbey Place
- 1747 Port Abbey Place
- 1815 Port Sheffield Place
- 1807 Port Sheffield Place