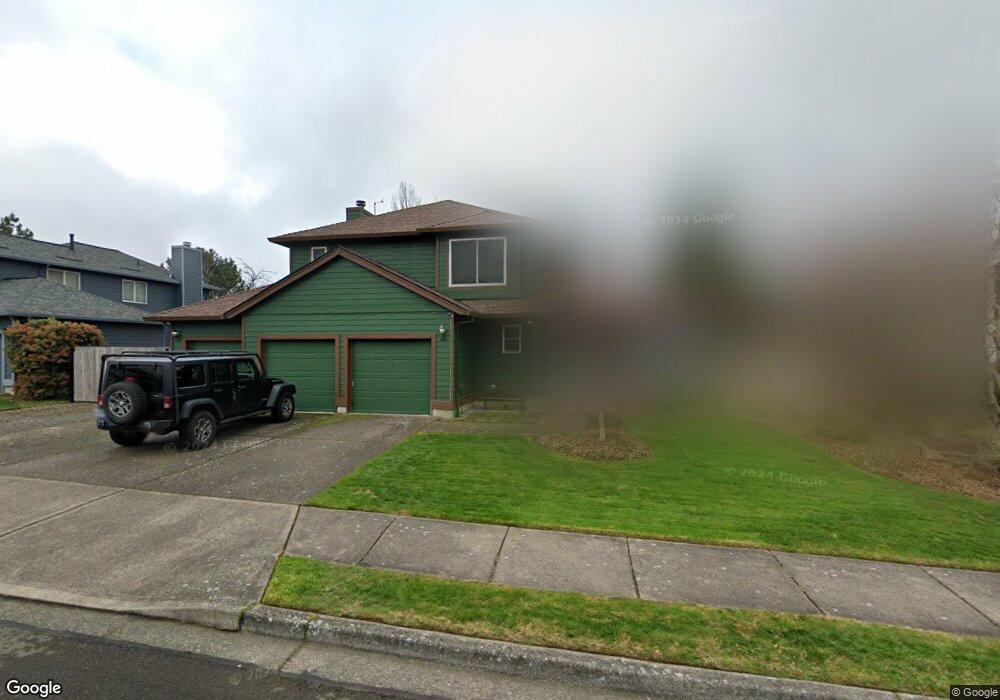
1815 SW Northstar Loop Troutdale, OR 97060
Town Center NeighborhoodEstimated Value: $493,725 - $554,000
3
Beds
3
Baths
1,685
Sq Ft
$312/Sq Ft
Est. Value
About This Home
This home is located at 1815 SW Northstar Loop, Troutdale, OR 97060 and is currently estimated at $526,431, approximately $312 per square foot. 1815 SW Northstar Loop is a home located in Multnomah County with nearby schools including Woodland Elementary School, Walt Morey Middle School, and Reynolds High School.
Ownership History
Date
Name
Owned For
Owner Type
Purchase Details
Closed on
Sep 22, 2021
Sold by
Cook Michele L
Bought by
Cook Michele L and Delcook Kenneth Del
Current Estimated Value
Home Financials for this Owner
Home Financials are based on the most recent Mortgage that was taken out on this home.
Original Mortgage
$364,000
Outstanding Balance
$305,249
Interest Rate
2.8%
Mortgage Type
New Conventional
Estimated Equity
$221,182
Purchase Details
Closed on
Jul 15, 2013
Sold by
Huber Leslie
Bought by
Cook Michelle L
Home Financials for this Owner
Home Financials are based on the most recent Mortgage that was taken out on this home.
Original Mortgage
$139,500
Interest Rate
4.46%
Mortgage Type
New Conventional
Purchase Details
Closed on
May 29, 1996
Sold by
Cherry Ridge Ltd Partnership
Bought by
Huber George B and Huber Michele L
Home Financials for this Owner
Home Financials are based on the most recent Mortgage that was taken out on this home.
Original Mortgage
$163,189
Interest Rate
7.97%
Mortgage Type
VA
Create a Home Valuation Report for This Property
The Home Valuation Report is an in-depth analysis detailing your home's value as well as a comparison with similar homes in the area
Home Values in the Area
Average Home Value in this Area
Purchase History
| Date | Buyer | Sale Price | Title Company |
|---|---|---|---|
| Cook Michele L | -- | Wfg Title | |
| Cook Michelle L | -- | Servicelink | |
| Huber George B | $159,990 | Chicago Title Insurance Co |
Source: Public Records
Mortgage History
| Date | Status | Borrower | Loan Amount |
|---|---|---|---|
| Open | Cook Michele L | $364,000 | |
| Closed | Cook Michelle L | $139,500 | |
| Closed | Huber George B | $163,189 |
Source: Public Records
Tax History Compared to Growth
Tax History
| Year | Tax Paid | Tax Assessment Tax Assessment Total Assessment is a certain percentage of the fair market value that is determined by local assessors to be the total taxable value of land and additions on the property. | Land | Improvement |
|---|---|---|---|---|
| 2025 | $5,158 | $279,620 | -- | -- |
| 2024 | $4,874 | $271,480 | -- | -- |
| 2023 | $4,746 | $263,580 | $0 | $0 |
| 2022 | $4,633 | $255,910 | $0 | $0 |
| 2021 | $4,525 | $248,460 | $0 | $0 |
| 2020 | $4,232 | $241,230 | $0 | $0 |
| 2019 | $4,062 | $234,210 | $0 | $0 |
| 2018 | $4,035 | $227,390 | $0 | $0 |
| 2017 | $4,026 | $220,770 | $0 | $0 |
| 2016 | $3,891 | $214,340 | $0 | $0 |
| 2015 | $3,794 | $208,100 | $0 | $0 |
| 2014 | $3,688 | $202,040 | $0 | $0 |
Source: Public Records
Map
Nearby Homes
- 1392 SW Berryessa Place
- 1953 SW Northstar Way
- 1106 SW Dottie Ct
- 1212 SW Edgefield Ave
- 821 SW 14th St
- 2326 SW Mcginnis Ave
- 839 SW Grant Way
- 1427 SW 24th St
- 24066 NE Treehill Dr Unit 12
- 809 SW Crestview Way
- 735 SW Sunset Way
- 24044 NE Treehill Dr Unit 6
- 2511 SW 23rd Cir
- 2020 SW Laura Ct
- 1226 SW Hensley Rd
- 1021 SW 24th St
- 2701 SW Latourell Place
- 114 Maple Blvd
- 23882 NE Treehill Dr Unit T3882
- 1018 SW Halsey St
- 1773 SW Northstar Loop
- 1837 SW Northstar Loop
- 1548 SW Northstar Loop
- 1556 SW Northstar Loop
- 1522 SW Northstar Loop
- 1751 SW Northstar Loop
- 1784 SW Northstar Loop
- 1826 SW Northstar Loop
- 1548 SW Berryessa Place
- 1532 SW Berryessa Place
- 1840 SW Northstar Loop
- 1762 SW Northstar Loop
- 1572 SW Northstar Loop
- 1504 SW Berryessa Place
- 1748 SW Northstar Loop Unit 1
- 1748 SW Northstar Loop
- 1868 SW Northstar Loop
- 1553 SW Northstar Loop
- 1435 SW Napoleon Place
- 1654 SW Northstar Loop