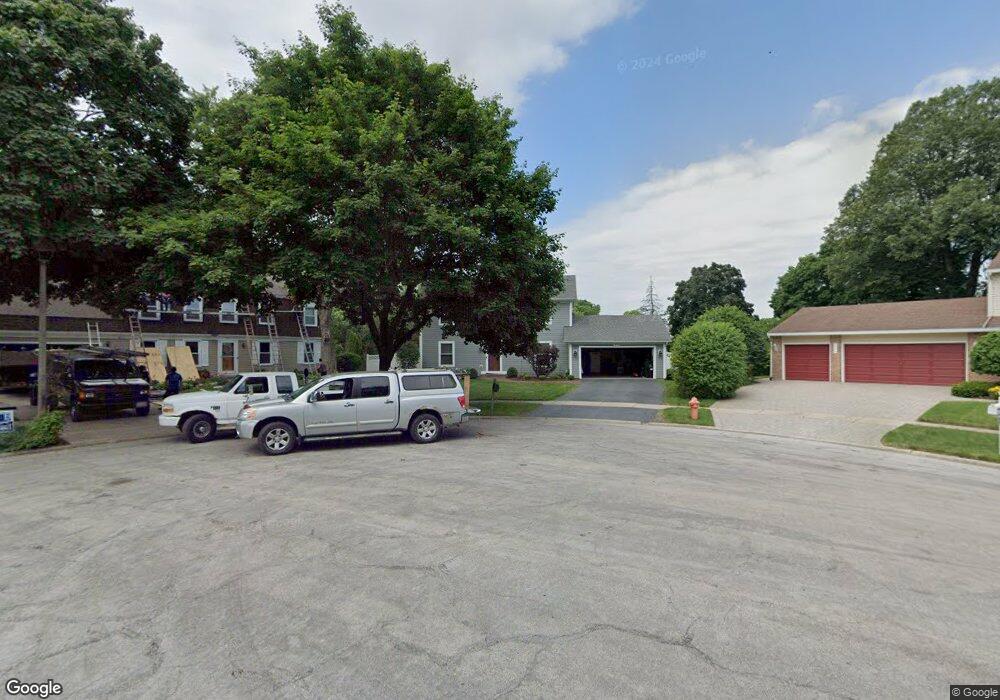
1815 Winola Ct Naperville, IL 60565
Signal Point NeighborhoodEstimated Value: $498,695 - $614,000
4
Beds
3
Baths
2,016
Sq Ft
$284/Sq Ft
Est. Value
About This Home
This home is located at 1815 Winola Ct, Naperville, IL 60565 and is currently estimated at $572,424, approximately $283 per square foot. 1815 Winola Ct is a home located in DuPage County with nearby schools including Scott Elementary School, Madison Jr High School, and Naperville Central High School.
Ownership History
Date
Name
Owned For
Owner Type
Purchase Details
Closed on
May 5, 2016
Sold by
Gilmore John H
Bought by
Poulaki Joshua J and Poulaki Christina
Current Estimated Value
Home Financials for this Owner
Home Financials are based on the most recent Mortgage that was taken out on this home.
Original Mortgage
$348,570
Interest Rate
3.5%
Mortgage Type
FHA
Purchase Details
Closed on
Oct 15, 2004
Sold by
Gilmore John H and Gilmore Margaret S
Bought by
Gilmore John H
Home Financials for this Owner
Home Financials are based on the most recent Mortgage that was taken out on this home.
Original Mortgage
$219,000
Interest Rate
5.85%
Mortgage Type
Stand Alone Refi Refinance Of Original Loan
Purchase Details
Closed on
Jan 5, 2004
Sold by
Relocation Resources International Inc
Bought by
Gilmore John H and Gilmore Margaret S
Home Financials for this Owner
Home Financials are based on the most recent Mortgage that was taken out on this home.
Original Mortgage
$218,000
Interest Rate
5.88%
Mortgage Type
Purchase Money Mortgage
Purchase Details
Closed on
Jun 13, 2003
Sold by
Hughes Teresa L
Bought by
Relocation Resources International Inc
Create a Home Valuation Report for This Property
The Home Valuation Report is an in-depth analysis detailing your home's value as well as a comparison with similar homes in the area
Home Values in the Area
Average Home Value in this Area
Purchase History
| Date | Buyer | Sale Price | Title Company |
|---|---|---|---|
| Poulaki Joshua J | $355,000 | Title Resources Guaranty Co | |
| Gilmore John H | -- | Ctic | |
| Gilmore John H | $272,500 | Git | |
| Relocation Resources International Inc | $272,500 | Git |
Source: Public Records
Mortgage History
| Date | Status | Borrower | Loan Amount |
|---|---|---|---|
| Previous Owner | Poulaki Joshua J | $348,570 | |
| Previous Owner | Gilmore John H | $219,000 | |
| Previous Owner | Gilmore John H | $218,000 |
Source: Public Records
Tax History
| Year | Tax Paid | Tax Assessment Tax Assessment Total Assessment is a certain percentage of the fair market value that is determined by local assessors to be the total taxable value of land and additions on the property. | Land | Improvement |
|---|---|---|---|---|
| 2024 | $8,106 | $140,316 | $62,532 | $77,784 |
| 2023 | $7,801 | $128,060 | $57,070 | $70,990 |
| 2022 | $7,410 | $121,510 | $54,150 | $67,360 |
| 2021 | $7,136 | $116,910 | $52,100 | $64,810 |
| 2020 | $6,982 | $114,800 | $51,160 | $63,640 |
| 2019 | $6,775 | $109,840 | $48,950 | $60,890 |
| 2018 | $6,778 | $108,950 | $48,950 | $60,000 |
| 2017 | $6,639 | $105,280 | $47,300 | $57,980 |
| 2016 | $6,911 | $101,470 | $45,590 | $55,880 |
| 2015 | $6,888 | $95,550 | $42,930 | $52,620 |
| 2014 | $6,936 | $93,180 | $41,080 | $52,100 |
| 2013 | $6,830 | $93,400 | $41,180 | $52,220 |
Source: Public Records
Map
Nearby Homes
- 475 Bourbon Ln
- 517 Sheffield Rd
- 621 Bourbon Ct
- 1715 Amelia Ct
- 425 Carriage Hill Rd
- 1712 Coach Dr
- 264 E Bailey Rd Unit C
- 1612 Indian Trail Dr
- 228 E Bailey Rd Unit F
- 307 Leeds Ct
- 144 E Bailey Rd Unit D
- 321 Carriage Hill Rd
- 138 E Bailey Rd Unit M
- 1123 Mill Race Ln
- 124 E Bailey Rd Unit E
- 309 Carriage Hill Rd
- 1217 River Oak Dr
- 805 Potomac Ave
- 1754 S Washington St Unit 1754
- 1751 S Washington St Unit 1
- 1819 Winola Ct
- 1809 Winola Ct
- 1829 Bristlecone Ct
- 1820 Winola Ct
- 1805 Winola Ct
- 534 Ursuline Ave
- 536 Ursuline Ave
- 1828 Bristlecone Ct
- 530 Ursuline Ave
- 1833 Bristlecone Ct
- 526 Ursuline Ave
- 524 Ursuline Ave
- 1816 Winola Ct
- 522 Ursuline Ave
- 1812 Winola Ct
- 520 Ursuline Ave
- 9S364 Naper Blvd
- 1837 Bristlecone Ct
- 1832 Bristlecone Ct
- 650 River Oak Dr
Your Personal Tour Guide
Ask me questions while you tour the home.