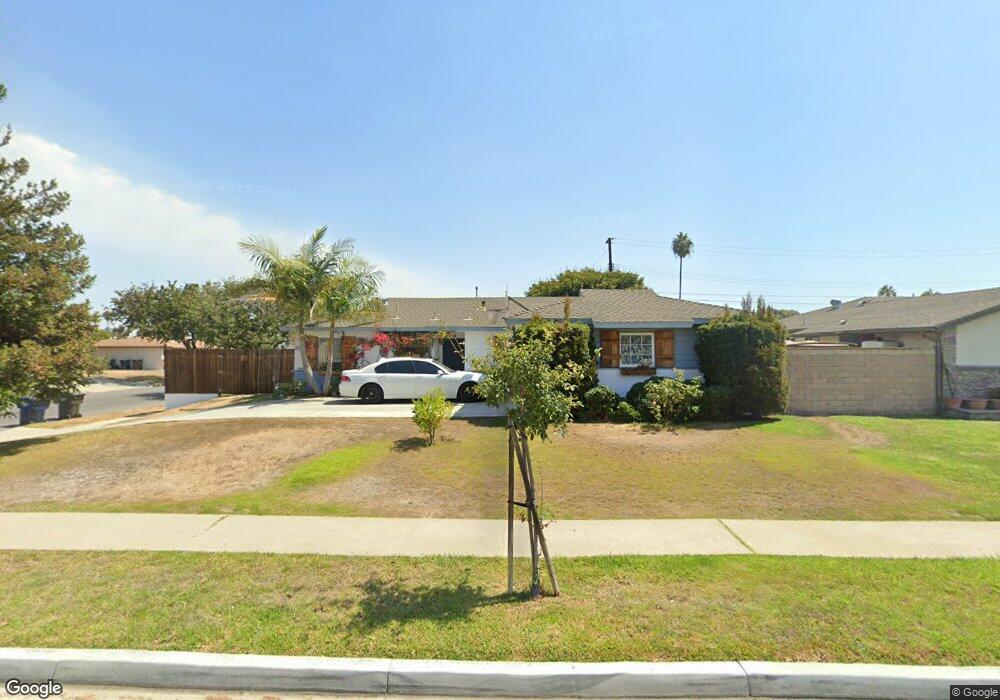
18152 Lisa Ln Huntington Beach, CA 92646
Estimated Value: $1,091,000 - $1,250,000
3
Beds
2
Baths
1,211
Sq Ft
$959/Sq Ft
Est. Value
About This Home
This home is located at 18152 Lisa Ln, Huntington Beach, CA 92646 and is currently estimated at $1,161,863, approximately $959 per square foot. 18152 Lisa Ln is a home located in Orange County with nearby schools including Lake View Elementary, Vista View Middle School, and Ocean View High.
Ownership History
Date
Name
Owned For
Owner Type
Purchase Details
Closed on
Jun 21, 2019
Sold by
Mosley Shawn T and Mosley Lisa Ann
Bought by
Mosley Shawn T and Mosley Lisa Ann
Current Estimated Value
Purchase Details
Closed on
Mar 17, 2009
Sold by
Radvansky Lisa
Bought by
Radvansky Lisa
Home Financials for this Owner
Home Financials are based on the most recent Mortgage that was taken out on this home.
Original Mortgage
$366,000
Outstanding Balance
$232,973
Interest Rate
5.15%
Mortgage Type
New Conventional
Estimated Equity
$928,890
Purchase Details
Closed on
Apr 14, 2008
Sold by
Radvansky Joseph P
Bought by
Radvansky Lisa
Purchase Details
Closed on
Apr 19, 2001
Sold by
Moore Linda S
Bought by
Radvansky Joseph Paul and Radvansky Lisa
Home Financials for this Owner
Home Financials are based on the most recent Mortgage that was taken out on this home.
Original Mortgage
$269,900
Interest Rate
7.15%
Create a Home Valuation Report for This Property
The Home Valuation Report is an in-depth analysis detailing your home's value as well as a comparison with similar homes in the area
Home Values in the Area
Average Home Value in this Area
Purchase History
| Date | Buyer | Sale Price | Title Company |
|---|---|---|---|
| Mosley Shawn T | -- | None Available | |
| Mosley Shawn T | -- | None Available | |
| Radvansky Lisa | -- | Lsi Title Company | |
| Radvansky Lisa | -- | None Available | |
| Radvansky Joseph Paul | $270,000 | First American Title Ins Co |
Source: Public Records
Mortgage History
| Date | Status | Borrower | Loan Amount |
|---|---|---|---|
| Open | Radvansky Lisa | $366,000 | |
| Closed | Radvansky Joseph Paul | $269,900 |
Source: Public Records
Tax History Compared to Growth
Tax History
| Year | Tax Paid | Tax Assessment Tax Assessment Total Assessment is a certain percentage of the fair market value that is determined by local assessors to be the total taxable value of land and additions on the property. | Land | Improvement |
|---|---|---|---|---|
| 2025 | $4,953 | $424,843 | $337,147 | $87,696 |
| 2024 | $4,953 | $416,513 | $330,536 | $85,977 |
| 2023 | $4,840 | $408,347 | $324,055 | $84,292 |
| 2022 | $4,767 | $400,341 | $317,701 | $82,640 |
| 2021 | $4,681 | $392,492 | $311,472 | $81,020 |
| 2020 | $4,629 | $388,468 | $308,278 | $80,190 |
| 2019 | $4,474 | $380,851 | $302,233 | $78,618 |
| 2018 | $4,373 | $373,384 | $296,307 | $77,077 |
| 2017 | $4,303 | $366,063 | $290,497 | $75,566 |
| 2016 | $4,129 | $358,886 | $284,801 | $74,085 |
| 2015 | $4,065 | $353,496 | $280,523 | $72,973 |
| 2014 | $3,984 | $346,572 | $275,028 | $71,544 |
Source: Public Records
Map
Nearby Homes
- 18101 Wharton Ln
- 18102 Hartlund Ln
- 8405 Sweetwater Cir
- 18021 Gulf Ln
- 17952 Seaglass Dr
- 18441 Patterson Ln
- 18507 Pueblo Cir
- 7827 Orchid Dr
- 7841 Essex Dr Unit 201
- 18555 Vallarta Dr
- 17722 Sergio Cir Unit 104
- 17722 Sergio Cir Unit 203
- 18232 Parkview Ln Unit 103
- 18272 Parkview Ln Unit 101
- 18601 Newland St Unit 59
- 18601 Newland St Unit 97
- 18601 Newland St Unit 12
- 18601 Newland St Unit 71
- 18601 Newland St Unit 38
- 8292 Darsy Dr
- 17952 Seaglass Ln
- 18172 Lisa Ln
- 18151 Wharton Ln
- 18161 Wharton Ln
- 18182 Lisa Ln
- 8231 Sterling Dr
- 8241 Sterling Dr
- 18151 Lisa Ln
- 18181 Wharton Ln
- 18171 Lisa Ln
- 17972 Olivia Ln
- 8251 Sterling Dr
- 8201 Sterling Dr
- 18181 Lisa Ln
- 18202 Lisa Ln
- 18191 Wharton Ln
- 18111 Wharton Ln
- 18191 Lisa Ln
- 8191 Sterling Dr
- 18162 Pemberco Cir