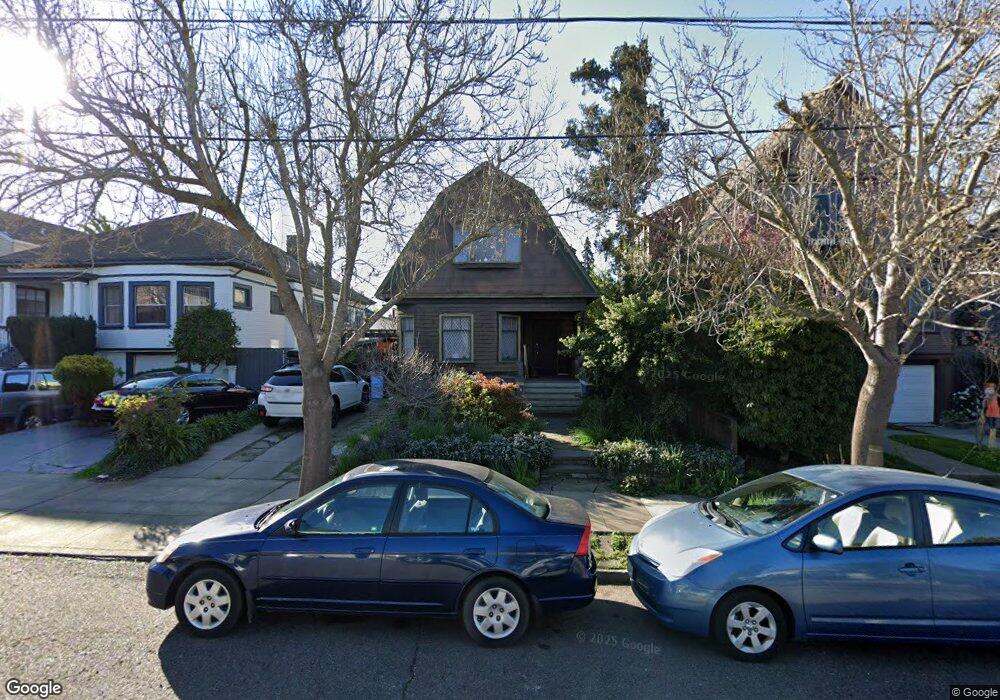
1816 62nd St Berkeley, CA 94703
South Berkeley NeighborhoodEstimated Value: $1,030,000 - $1,172,000
3
Beds
2
Baths
1,386
Sq Ft
$796/Sq Ft
Est. Value
About This Home
This home is located at 1816 62nd St, Berkeley, CA 94703 and is currently estimated at $1,102,930, approximately $795 per square foot. 1816 62nd St is a home located in Alameda County with nearby schools including Malcolm X Elementary School, John Muir Elementary School, and Emerson Elementary School.
Ownership History
Date
Name
Owned For
Owner Type
Purchase Details
Closed on
May 28, 2002
Sold by
Depierris Marta S and Fajre Susana
Bought by
Steichen David
Current Estimated Value
Home Financials for this Owner
Home Financials are based on the most recent Mortgage that was taken out on this home.
Original Mortgage
$356,800
Outstanding Balance
$151,716
Interest Rate
6.89%
Estimated Equity
$951,214
Purchase Details
Closed on
Feb 15, 2000
Sold by
Parker Felipe
Bought by
Fajre Susana
Purchase Details
Closed on
Jun 3, 1999
Sold by
Fajre Susana
Bought by
Parker Felipe
Create a Home Valuation Report for This Property
The Home Valuation Report is an in-depth analysis detailing your home's value as well as a comparison with similar homes in the area
Home Values in the Area
Average Home Value in this Area
Purchase History
| Date | Buyer | Sale Price | Title Company |
|---|---|---|---|
| Steichen David | $446,000 | Old Republic Title Company | |
| Fajre Susana | -- | American Title Co | |
| Parker Felipe | -- | -- |
Source: Public Records
Mortgage History
| Date | Status | Borrower | Loan Amount |
|---|---|---|---|
| Open | Steichen David | $356,800 | |
| Closed | Steichen David | $66,900 |
Source: Public Records
Tax History
| Year | Tax Paid | Tax Assessment Tax Assessment Total Assessment is a certain percentage of the fair market value that is determined by local assessors to be the total taxable value of land and additions on the property. | Land | Improvement |
|---|---|---|---|---|
| 2025 | $11,159 | $628,195 | $190,558 | $444,637 |
| 2024 | $11,159 | $615,742 | $186,822 | $435,920 |
| 2023 | $10,907 | $610,534 | $183,160 | $427,374 |
| 2022 | $10,672 | $591,564 | $179,569 | $418,995 |
| 2021 | $10,671 | $579,828 | $176,048 | $410,780 |
| 2020 | $10,007 | $580,813 | $174,244 | $406,569 |
| 2019 | $9,514 | $569,427 | $170,828 | $398,599 |
| 2018 | $9,330 | $558,264 | $167,479 | $390,785 |
| 2017 | $8,993 | $547,320 | $164,196 | $383,124 |
| 2016 | $8,638 | $536,591 | $160,977 | $375,614 |
| 2015 | $8,511 | $528,534 | $158,560 | $369,974 |
| 2014 | $8,376 | $518,184 | $155,455 | $362,729 |
Source: Public Records
Map
Nearby Homes
- 3233 Ellis St
- 5914 Martin Luther King jr Way
- 6015 Adeline St
- 6300 Shattuck Ave Unit 1
- 6320 Shattuck Ave
- 5812 Dover St
- 667 Alcatraz Ave
- 667 & 667A Alcatraz Ave
- 6555 Shattuck Ave
- 3214 California St
- 3138 California St
- 5718 Adeline St
- 3224 Sacramento St
- 3114 California St
- 3110 California St
- 968 62nd St
- 558 58th St
- 629 66th St
- 2124 Prince St
- 1646 Ashby Ave
Your Personal Tour Guide
Ask me questions while you tour the home.