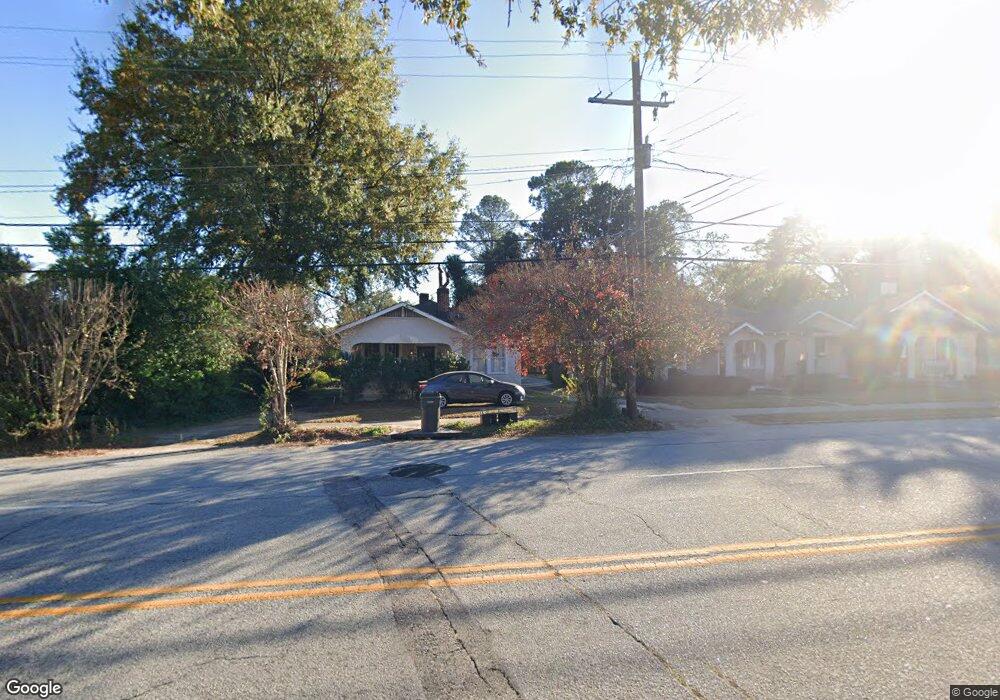
1816 Central Ave Augusta, GA 30904
Midtown Augusta NeighborhoodEstimated Value: $127,000 - $157,000
2
Beds
1
Bath
1,088
Sq Ft
$133/Sq Ft
Est. Value
About This Home
This home is located at 1816 Central Ave, Augusta, GA 30904 and is currently estimated at $144,715, approximately $133 per square foot. 1816 Central Ave is a home located in Richmond County with nearby schools including Monte Sano Elementary School, Johnson Magnet, and Tutt Middle School.
Ownership History
Date
Name
Owned For
Owner Type
Purchase Details
Closed on
Oct 27, 2020
Sold by
Ritch Perry H
Bought by
R & R Innovations Llc
Current Estimated Value
Purchase Details
Closed on
Mar 17, 2005
Sold by
Deutsche Bank National Trust Co
Bought by
Rich Perry
Home Financials for this Owner
Home Financials are based on the most recent Mortgage that was taken out on this home.
Original Mortgage
$65,010
Interest Rate
5.62%
Mortgage Type
Purchase Money Mortgage
Purchase Details
Closed on
Sep 7, 2004
Sold by
Bold Randy A
Bought by
Deutsche Bank National Trust Co and Vendee Mortgage Trust Series 1996-3
Purchase Details
Closed on
Jul 16, 1996
Sold by
Veterans Affairs Se
Bought by
Bold Randy A
Purchase Details
Closed on
Nov 7, 1995
Sold by
Allied Group Mortga
Bought by
Veterans Affairs Se
Purchase Details
Closed on
Oct 15, 1992
Sold by
Hearn Edna R
Bought by
Williams Robert
Purchase Details
Closed on
Jul 2, 1986
Sold by
Jennings Robert C
Bought by
Hearn Edna R
Create a Home Valuation Report for This Property
The Home Valuation Report is an in-depth analysis detailing your home's value as well as a comparison with similar homes in the area
Home Values in the Area
Average Home Value in this Area
Purchase History
| Date | Buyer | Sale Price | Title Company |
|---|---|---|---|
| R & R Innovations Llc | -- | -- | |
| Rich Perry | $43,000 | -- | |
| Ritch Perry H | $43,000 | -- | |
| Deutsche Bank National Trust Co | $48,510 | -- | |
| Deutsche Bank National Trust Co | $48,500 | -- | |
| Bold Randy A | -- | -- | |
| Veterans Affairs Se | $33,300 | -- | |
| Allied Group Mortga | $33,300 | -- | |
| Williams Robert | $43,500 | -- | |
| Hearn Edna R | -- | -- |
Source: Public Records
Mortgage History
| Date | Status | Borrower | Loan Amount |
|---|---|---|---|
| Previous Owner | Ritch Perry H | $65,010 |
Source: Public Records
Tax History
| Year | Tax Paid | Tax Assessment Tax Assessment Total Assessment is a certain percentage of the fair market value that is determined by local assessors to be the total taxable value of land and additions on the property. | Land | Improvement |
|---|---|---|---|---|
| 2025 | $1,852 | $54,244 | $5,760 | $48,484 |
| 2024 | $1,852 | $48,036 | $5,760 | $42,276 |
| 2023 | $1,706 | $50,804 | $5,760 | $45,044 |
| 2022 | $1,340 | $33,676 | $5,760 | $27,916 |
| 2021 | $1,256 | $28,165 | $5,760 | $22,405 |
| 2020 | $1,174 | $26,128 | $5,760 | $20,368 |
| 2019 | $1,117 | $22,784 | $5,760 | $17,024 |
| 2018 | $1,125 | $22,784 | $5,760 | $17,024 |
| 2017 | $1,120 | $22,784 | $5,760 | $17,024 |
| 2016 | $1,092 | $22,784 | $5,760 | $17,024 |
| 2015 | $1,052 | $22,784 | $5,760 | $17,024 |
| 2014 | $994 | $22,422 | $5,645 | $16,778 |
Source: Public Records
Map
Nearby Homes
- 1315 Murphy St
- 1307 Merry St
- 1316 Wilson St
- 1819 Mcdowell St
- 1834 Woodrow St
- 1827 Mcdowell St
- 1712 Central Ave
- 1802 Wilson Place
- 1740 Verdery St
- 1823 Wrightsboro Rd
- 1321 Holden St
- 1729 Verdery St
- 1307 Beman St
- 1718 Verdery St
- 1716 Verdery St
- 1409 Maddox St
- 1102 Murphy St
- 2014 Richmond Ave
- 1004 Murphy St
- 940 Russell St
- 1814 Central Ave
- 1852 Central Ave
- 1812 Central Ave
- 1854 Central Ave
- 1307 Murphy St
- 1318 Murphy St
- 1315 Murphy St
- 1856 Central Ave
- 1309 Murphy St
- 1302 Wilson St
- 1304 Wilson St
- 1858 Central Ave
- 1311 Murphy St
- 1306 Wilson St
- 1839 Central Ave
- 1808 Central Ave
- 1308 Wilson St
- 1313 Murphy St
- 1203 Murphy St
- 1304 Murphy St
Your Personal Tour Guide
Ask me questions while you tour the home.