1816 Corley St Ruston, LA 71270
Estimated Value: $151,000 - $237,000
3
Beds
2
Baths
1,500
Sq Ft
$123/Sq Ft
Est. Value
About This Home
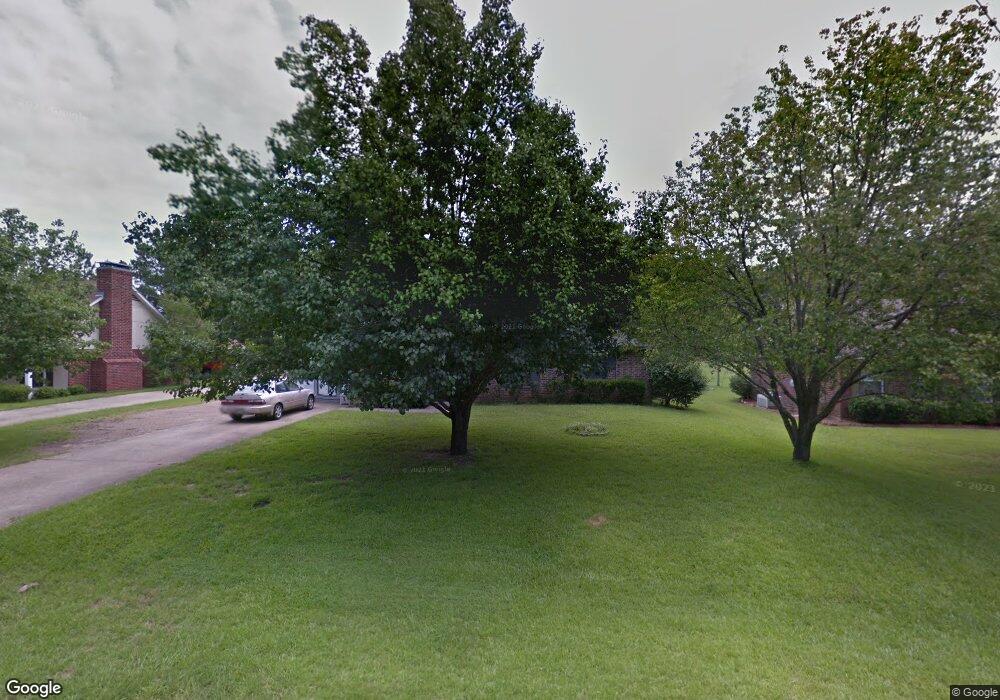
This home is located at 1816 Corley St, Ruston, LA 71270 and is currently estimated at $184,755, approximately $123 per square foot. 1816 Corley St is a home located in Lincoln Parish with nearby schools including Glen View Elementary School, Cypress Springs Elementary School, and Ruston Junior High School.
Ownership History
Date
Name
Owned For
Owner Type
Purchase Details
Closed on
Mar 29, 2012
Sold by
Prince Ruth G and Prince Hershell Robert
Bought by
Beech Connor Pittman and Beech Laura Trauth
Current Estimated Value
Purchase Details
Closed on
Jul 18, 2006
Sold by
Campbell Debra L
Bought by
Gantt Prince Ruth
Home Financials for this Owner
Home Financials are based on the most recent Mortgage that was taken out on this home.
Original Mortgage
$108,650
Interest Rate
6.67%
Mortgage Type
Purchase Money Mortgage
Purchase Details
Closed on
May 31, 2005
Sold by
Edwards Bennett Stanley and Bennett Lisa Carol Payton
Bought by
Campbell Debra L
Home Financials for this Owner
Home Financials are based on the most recent Mortgage that was taken out on this home.
Original Mortgage
$115,000
Interest Rate
5.83%
Mortgage Type
Purchase Money Mortgage
Create a Home Valuation Report for This Property
The Home Valuation Report is an in-depth analysis detailing your home's value as well as a comparison with similar homes in the area
Purchase History
| Date | Buyer | Sale Price | Title Company |
|---|---|---|---|
| Beech Connor Pittman | -- | None Available | |
| Gantt Prince Ruth | $122,000 | None Available | |
| Campbell Debra L | $115,000 | None Available |
Source: Public Records
Mortgage History
| Date | Status | Borrower | Loan Amount |
|---|---|---|---|
| Previous Owner | Gantt Prince Ruth | $108,650 | |
| Previous Owner | Campbell Debra L | $115,000 |
Source: Public Records
Tax History
| Year | Tax Paid | Tax Assessment Tax Assessment Total Assessment is a certain percentage of the fair market value that is determined by local assessors to be the total taxable value of land and additions on the property. | Land | Improvement |
|---|---|---|---|---|
| 2025 | $855 | $10,021 | $1,628 | $8,393 |
| 2024 | $855 | $10,021 | $1,628 | $8,393 |
| 2023 | $989 | $11,123 | $1,702 | $9,421 |
| 2022 | $993 | $11,123 | $1,702 | $9,421 |
| 2021 | $920 | $11,123 | $1,702 | $9,421 |
| 2020 | $834 | $10,029 | $1,702 | $8,327 |
| 2019 | $901 | $11,098 | $1,702 | $9,396 |
| 2018 | $877 | $11,098 | $1,702 | $9,396 |
| 2017 | $879 | $11,098 | $1,702 | $9,396 |
| 2016 | $876 | $0 | $0 | $0 |
| 2015 | $965 | $11,241 | $2,220 | $9,021 |
| 2013 | $981 | $11,241 | $2,220 | $9,021 |
Source: Public Records
Map
Nearby Homes
- 1804 Corley St
- 1904 Mimosa Cir
- 1507 Dauphine Dr
- 1508 Bonaparte Dr
- 1112 Wedgewood Dr
- 1111 Rita Ln
- 1113 Lisa Ln
- 1114 Abby Ln
- 2111 W Kentucky Ave
- Kavanaugh Rd
- 1322 Cooktown Rd
- 901 Pennington Ln
- 904 Sherwood Dr
- S Service Rd
- 2158 Llangeler Dr
- 1201 Gains Ave
- 542 Toma Lodge Dr
- 516 Glendale Dr
- 0 Gordon Dr
- 902 Arnold St
- 1812 Corley St
- 1820 Corley St
- 1808 Corley St
- 1809 Corley St
- 1811 Corley St
- 1807 Corley St
- 1805 Corley St
- 2012 Alexander Ave
- 2016 Alexander Ave
- 2008 Alexander Ave
- 1803 Corley St
- 2004 Alexander Ave
- 1806 Brooks St
- 1808 Brooks St
- 1801 Corley St
- 1804 Brooks St
- 1912 Mimosa Dr
- 1802 Brooks St
- 1712 Broadway Ave
- 1913 Mimosa Dr
Your Personal Tour Guide
Ask me questions while you tour the home.