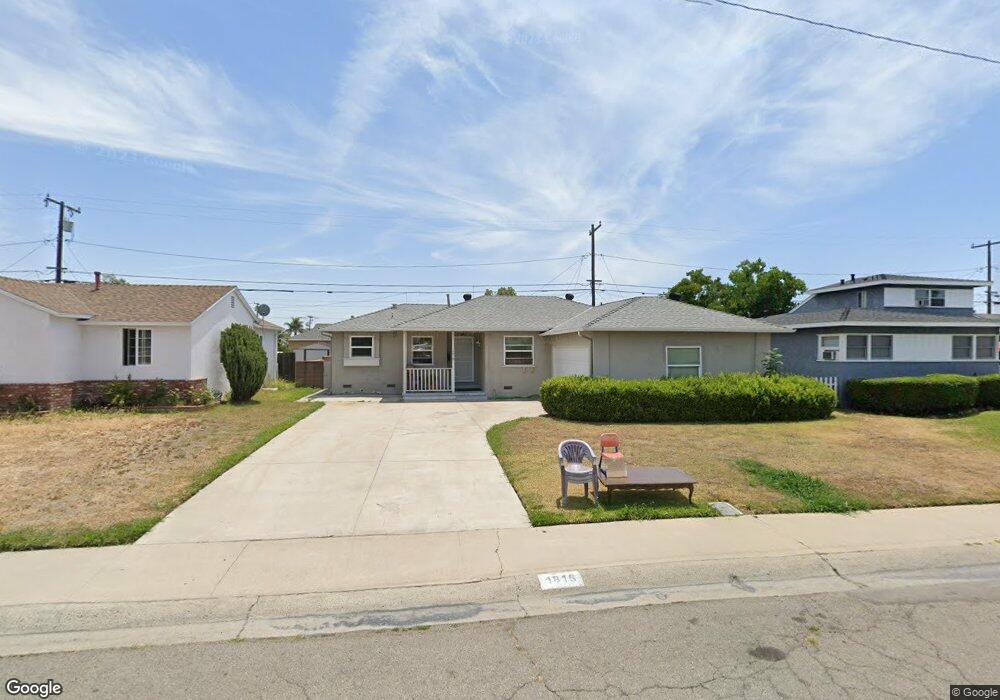
1816 E Elm St Anaheim, CA 92805
North Anaheim NeighborhoodEstimated Value: $625,000 - $872,000
3
Beds
2
Baths
1,105
Sq Ft
$698/Sq Ft
Est. Value
About This Home
This home is located at 1816 E Elm St, Anaheim, CA 92805 and is currently estimated at $771,770, approximately $698 per square foot. 1816 E Elm St is a home located in Orange County with nearby schools including Abraham Lincoln Elementary School, Sycamore Junior High School, and Anaheim High School.
Ownership History
Date
Name
Owned For
Owner Type
Purchase Details
Closed on
Jul 6, 2012
Sold by
Patel Dharmesh A and Patel Sonahlbahen P
Bought by
Patel Real Estate Investments Llc
Current Estimated Value
Purchase Details
Closed on
Apr 9, 2012
Sold by
Patel Dharmesh A
Bought by
Patel Dharmesh A and Patel Sonalbahen P
Purchase Details
Closed on
Dec 12, 2011
Sold by
Patel Dharmesh A
Bought by
Patel Dharmesh A and Patel Sonalbahen Parshottamdas
Purchase Details
Closed on
Mar 9, 1999
Sold by
Patel Ambaram K and Patel Kokila A
Bought by
Patel Ambaram K and Patel Kokila A
Home Financials for this Owner
Home Financials are based on the most recent Mortgage that was taken out on this home.
Original Mortgage
$113,500
Interest Rate
6.7%
Create a Home Valuation Report for This Property
The Home Valuation Report is an in-depth analysis detailing your home's value as well as a comparison with similar homes in the area
Home Values in the Area
Average Home Value in this Area
Purchase History
| Date | Buyer | Sale Price | Title Company |
|---|---|---|---|
| Patel Real Estate Investments Llc | $151,000 | None Available | |
| Patel Dharmesh A | -- | None Available | |
| Patel Dharmesh A | -- | None Available | |
| Patel Dharmesh A | -- | None Available | |
| Patel Ambaram K | -- | Old Republic Title Company | |
| Patel Dharmesh A | -- | Old Republic Title Company |
Source: Public Records
Mortgage History
| Date | Status | Borrower | Loan Amount |
|---|---|---|---|
| Previous Owner | Patel Ambaram K | $113,500 |
Source: Public Records
Tax History
| Year | Tax Paid | Tax Assessment Tax Assessment Total Assessment is a certain percentage of the fair market value that is determined by local assessors to be the total taxable value of land and additions on the property. | Land | Improvement |
|---|---|---|---|---|
| 2025 | $3,191 | $259,924 | $196,576 | $63,348 |
| 2024 | $3,191 | $254,828 | $192,722 | $62,106 |
| 2023 | $3,122 | $249,832 | $188,943 | $60,889 |
| 2022 | $3,080 | $244,934 | $185,238 | $59,696 |
| 2021 | $3,083 | $240,132 | $181,606 | $58,526 |
| 2020 | $3,069 | $237,670 | $179,744 | $57,926 |
| 2019 | $2,982 | $233,010 | $176,219 | $56,791 |
| 2018 | $2,923 | $228,442 | $172,764 | $55,678 |
| 2017 | $2,812 | $223,963 | $169,376 | $54,587 |
| 2016 | $2,802 | $219,572 | $166,055 | $53,517 |
| 2015 | $2,777 | $216,274 | $163,560 | $52,714 |
| 2014 | $2,612 | $212,038 | $160,356 | $51,682 |
Source: Public Records
Map
Nearby Homes
- 539 S Lexington Place
- 2113 E Westport Dr
- 153 N Evelyn Dr
- 1804 E South St
- 2321 E Puritan Ln
- 400 N Peach Knoll
- 206 N Clark Terrace
- 568 S Grove Ave
- Plan 1827 at Sunflower
- 2420 E Agave St Unit 5
- 2420 E Agave St Unit 6
- 2410 E Agave St Unit 3
- 120 S Sunkist St
- 1425 E Vermont Ave
- 637 N Anna Dr
- 527 N Anna Dr
- 629 S Kinney Way
- 728 S Vale Ave
- 734 S Vale Ave
- 1770 E Sandalwood Ave
- 1822 E Elm St
- 1812 E Elm St
- 1831 E Willow St
- 1905 E Willow St
- 1827 E Willow St
- 1901 E Willow St
- 1826 E Elm St
- 1806 E Elm St
- 1909 E Willow St
- 1819 E Willow St
- 1815 E Elm St
- 1821 E Elm St
- 1811 E Elm St
- 1915 E Willow St
- 1832 E Elm St
- 1802 E Elm St
- 1825 E Elm St
- 1815 E Willow St
- 1809 E Elm St
- 1831 E Elm St
Your Personal Tour Guide
Ask me questions while you tour the home.