Estimated Value: $343,359 - $413,000
2
Beds
1
Bath
1,150
Sq Ft
$320/Sq Ft
Est. Value
About This Home
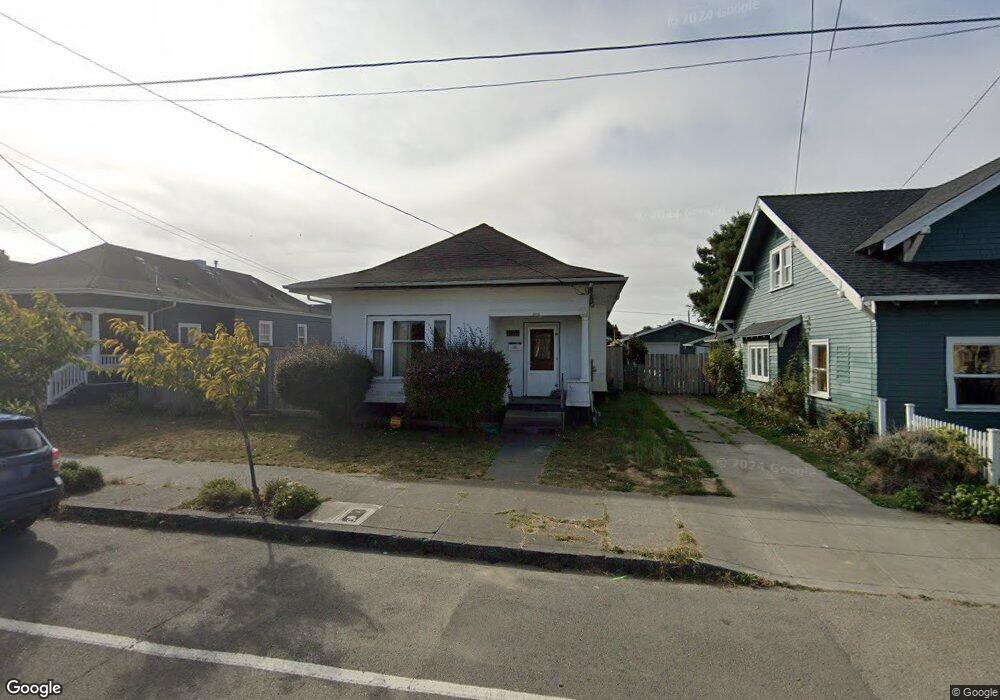
This home is located at 1816 J St, Eureka, CA 95501 and is currently estimated at $368,090, approximately $320 per square foot. 1816 J St is a home located in Humboldt County with nearby schools including Washington Elementary School, Catherine L. Zane Middle School, and Eureka Senior High School.
Ownership History
Date
Name
Owned For
Owner Type
Purchase Details
Closed on
Mar 18, 2009
Sold by
Vick Matthew R and Buyant Kimberly A
Bought by
Vick Matthew R
Current Estimated Value
Purchase Details
Closed on
Jan 15, 2002
Sold by
Bohrer Janet M
Bought by
Vick Matthew R and Bryant Kimberley A
Home Financials for this Owner
Home Financials are based on the most recent Mortgage that was taken out on this home.
Original Mortgage
$118,473
Interest Rate
6.99%
Mortgage Type
FHA
Purchase Details
Closed on
Dec 6, 2000
Sold by
Seamands Cynthia E
Bought by
Bohrer Janet M
Purchase Details
Closed on
Jul 5, 2000
Sold by
Beckwith Rose M
Bought by
Seamands Cynthia E
Home Financials for this Owner
Home Financials are based on the most recent Mortgage that was taken out on this home.
Original Mortgage
$79,540
Interest Rate
8.12%
Create a Home Valuation Report for This Property
The Home Valuation Report is an in-depth analysis detailing your home's value as well as a comparison with similar homes in the area
Home Values in the Area
Average Home Value in this Area
Purchase History
| Date | Buyer | Sale Price | Title Company |
|---|---|---|---|
| Vick Matthew R | -- | None Available | |
| Vick Matthew R | $120,000 | Humboldt Land Title Company | |
| Bohrer Janet M | $95,000 | Humboldt Land Title Company | |
| Seamands Cynthia E | $82,000 | Humboldt Land Title Company |
Source: Public Records
Mortgage History
| Date | Status | Borrower | Loan Amount |
|---|---|---|---|
| Previous Owner | Vick Matthew R | $118,473 | |
| Previous Owner | Seamands Cynthia E | $79,540 |
Source: Public Records
Tax History
| Year | Tax Paid | Tax Assessment Tax Assessment Total Assessment is a certain percentage of the fair market value that is determined by local assessors to be the total taxable value of land and additions on the property. | Land | Improvement |
|---|---|---|---|---|
| 2025 | $1,748 | $177,103 | $51,691 | $125,412 |
| 2024 | $1,748 | $173,631 | $50,678 | $122,953 |
| 2023 | $1,722 | $170,228 | $49,685 | $120,543 |
| 2022 | $1,786 | $166,891 | $48,711 | $118,180 |
| 2021 | $1,671 | $163,619 | $47,756 | $115,863 |
| 2020 | $1,658 | $161,942 | $47,267 | $114,675 |
| 2019 | $1,622 | $158,768 | $46,341 | $112,427 |
| 2018 | $1,597 | $155,656 | $45,433 | $110,223 |
| 2017 | $1,587 | $152,605 | $44,543 | $108,062 |
| 2016 | $1,586 | $149,614 | $43,670 | $105,944 |
| 2015 | $1,571 | $147,368 | $43,015 | $104,353 |
| 2014 | $1,467 | $144,482 | $42,173 | $102,309 |
Source: Public Records
Map
Nearby Homes
Your Personal Tour Guide
Ask me questions while you tour the home.