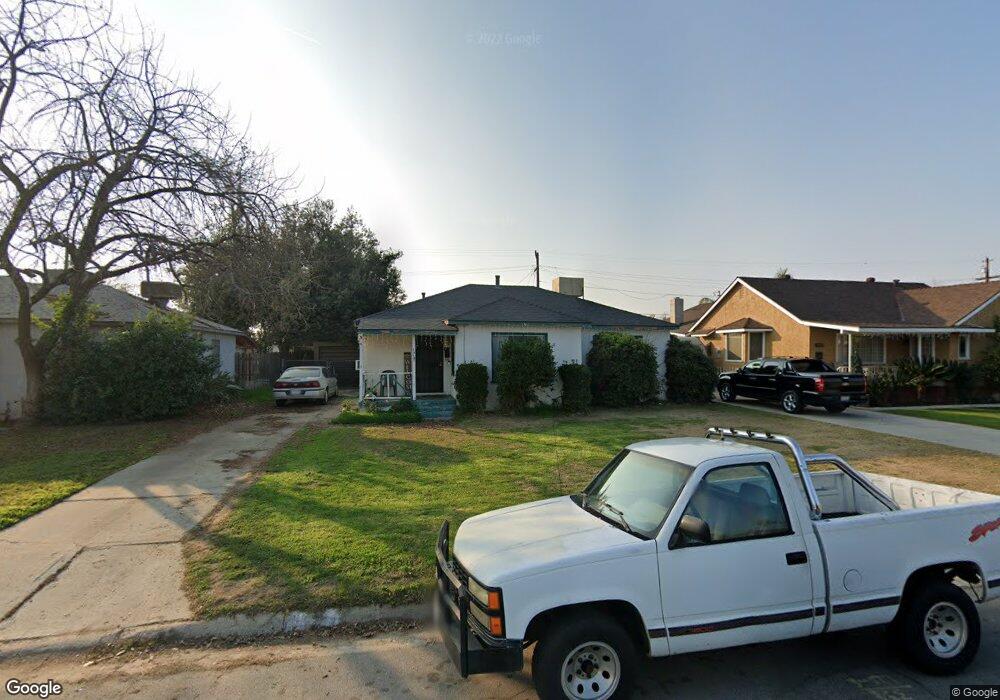
1816 Manley Ave Bakersfield, CA 93306
Estimated Value: $307,000 - $338,000
3
Beds
1
Bath
1,153
Sq Ft
$276/Sq Ft
Est. Value
About This Home
This home is located at 1816 Manley Ave, Bakersfield, CA 93306 and is currently estimated at $318,398, approximately $276 per square foot. 1816 Manley Ave is a home located in Kern County with nearby schools including Harding Elementary School, Compton Junior High School, and East Bakersfield High School.
Ownership History
Date
Name
Owned For
Owner Type
Purchase Details
Closed on
Feb 8, 2024
Sold by
Gomez Benjamin and Gomez Higinia
Bought by
Diamante Investments Llc
Current Estimated Value
Home Financials for this Owner
Home Financials are based on the most recent Mortgage that was taken out on this home.
Original Mortgage
$183,400
Outstanding Balance
$180,153
Interest Rate
6.6%
Mortgage Type
Construction
Estimated Equity
$138,245
Purchase Details
Closed on
Jun 20, 2013
Sold by
Teves Nancy Carolyn
Bought by
Gomez Benjamin and Gomez Higinia
Purchase Details
Closed on
Aug 15, 2005
Sold by
Teves Nancy Carolyn
Bought by
Teves John Carroll and Teves Nancy Carolyn
Purchase Details
Closed on
Mar 13, 2001
Sold by
Abbott Julia E and The Milo M & Julia E Abbott Re
Bought by
Teves Nancy C and The Julia E Abbott Trust
Purchase Details
Closed on
Mar 23, 1994
Sold by
Abbott Julia E
Bought by
Abbott Milo M and Abbott Julia E
Create a Home Valuation Report for This Property
The Home Valuation Report is an in-depth analysis detailing your home's value as well as a comparison with similar homes in the area
Home Values in the Area
Average Home Value in this Area
Purchase History
| Date | Buyer | Sale Price | Title Company |
|---|---|---|---|
| Diamante Investments Llc | -- | Stewart Title | |
| Gomez Benjamin | $70,000 | Placer Title Company | |
| Teves Nancy Carolyn | -- | Placer Title Company | |
| Teves John Carroll | -- | -- | |
| Teves Nancy Carolyn | -- | -- | |
| Teves Nancy C | -- | -- | |
| Abbott Milo M | -- | -- |
Source: Public Records
Mortgage History
| Date | Status | Borrower | Loan Amount |
|---|---|---|---|
| Open | Diamante Investments Llc | $183,400 |
Source: Public Records
Tax History
| Year | Tax Paid | Tax Assessment Tax Assessment Total Assessment is a certain percentage of the fair market value that is determined by local assessors to be the total taxable value of land and additions on the property. | Land | Improvement |
|---|---|---|---|---|
| 2025 | $1,942 | $329,120 | $66,300 | $262,820 |
| 2024 | $1,942 | $84,500 | $12,068 | $72,432 |
| 2023 | $1,882 | $82,844 | $11,832 | $71,012 |
| 2022 | $1,795 | $81,220 | $11,600 | $69,620 |
| 2021 | $1,699 | $79,628 | $11,373 | $68,255 |
| 2020 | $1,662 | $78,813 | $11,257 | $67,556 |
| 2019 | $1,606 | $78,813 | $11,257 | $67,556 |
| 2018 | $1,563 | $75,755 | $10,821 | $64,934 |
| 2017 | $1,545 | $74,270 | $10,609 | $63,661 |
| 2016 | $1,340 | $72,814 | $10,401 | $62,413 |
| 2015 | $1,336 | $71,721 | $10,245 | $61,476 |
| 2014 | $1,287 | $70,317 | $10,045 | $60,272 |
Source: Public Records
Map
Nearby Homes
- 1805 Morgan Ln
- 2417 Edwards Ave
- 2218 Lindora St
- 2239 Elton Ave
- 1801 Los Robles Dr
- 2613 Edwards Ave
- 1717 Locust Ravine
- 1708 Camino Primavera
- 1704 Camino Primavera
- 2720 Edwards Ave
- 2006 Quincy St
- 2708 College Ave
- 2712 Primera Vista
- 2525 Avenida Escuela
- 2102 Pacific St
- 2301 Pacific Dr
- 2100 Kent Dr
- 1717 Camino Sierra
- 2100 Oregon St
- 2814 College Ave
- 1820 Manley Ave
- 1812 Manley Ave
- 1824 Manley Ave
- 1808 Manley Ave
- 1825 Morgan Ln
- 1821 Morgan Ln
- 1819 Morgan Ln
- 1829 Morgan Ln
- 1817 Manley Ave
- 1809 Morgan Ln
- 1804 Manley Ave
- 1821 Manley Ave
- 1813 Manley Ave
- 1825 Manley Ave
- 1809 Manley Ave
- 1800 Manley Ave
- 1900 Manley Ave
- 1805 Manley Ave
- 1803 Morgan Ln
- 1901 Manley Ave