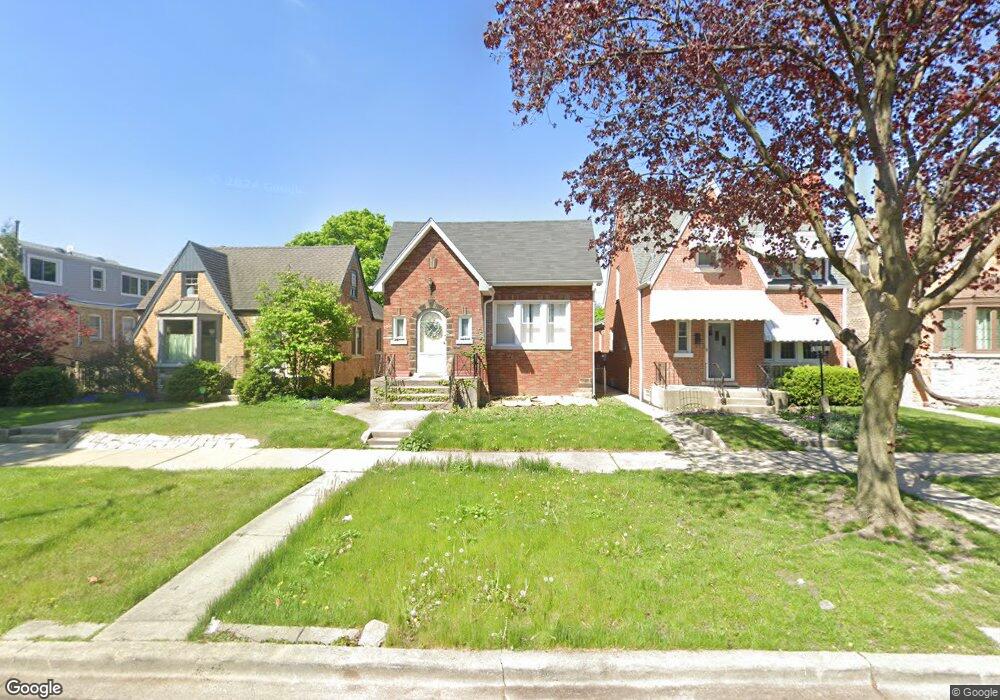
1816 N Natchez Ave Chicago, IL 60707
Galewood NeighborhoodEstimated Value: $355,000 - $410,000
3
Beds
1
Bath
1,355
Sq Ft
$281/Sq Ft
Est. Value
About This Home
This home is located at 1816 N Natchez Ave, Chicago, IL 60707 and is currently estimated at $380,888, approximately $281 per square foot. 1816 N Natchez Ave is a home located in Cook County with nearby schools including Lovett Elementary School, Steinmetz College Prep, and Acero - Roberto Clemente Elementary School.
Ownership History
Date
Name
Owned For
Owner Type
Purchase Details
Closed on
May 19, 2006
Sold by
Sinkievicius Henrichas
Bought by
Vilchis Richard and Vilchis Alejandra
Current Estimated Value
Home Financials for this Owner
Home Financials are based on the most recent Mortgage that was taken out on this home.
Original Mortgage
$369,900
Outstanding Balance
$216,915
Interest Rate
6.62%
Mortgage Type
Fannie Mae Freddie Mac
Estimated Equity
$163,973
Purchase Details
Closed on
Oct 25, 2005
Sold by
Carter Carol and Carter Walker Carol
Bought by
Sinkevicius Henrichas
Home Financials for this Owner
Home Financials are based on the most recent Mortgage that was taken out on this home.
Original Mortgage
$232,800
Interest Rate
5.37%
Mortgage Type
Fannie Mae Freddie Mac
Purchase Details
Closed on
Oct 23, 1995
Sold by
Coleman Gerald W and Coleman Susana Lebron
Bought by
Carter Carol
Home Financials for this Owner
Home Financials are based on the most recent Mortgage that was taken out on this home.
Original Mortgage
$95,000
Interest Rate
7.61%
Create a Home Valuation Report for This Property
The Home Valuation Report is an in-depth analysis detailing your home's value as well as a comparison with similar homes in the area
Home Values in the Area
Average Home Value in this Area
Purchase History
| Date | Buyer | Sale Price | Title Company |
|---|---|---|---|
| Vilchis Richard | $369,000 | Multiple | |
| Sinkevicius Henrichas | $291,000 | Prairie Title | |
| Carter Carol | $120,000 | Attorneys Title Guaranty Fun |
Source: Public Records
Mortgage History
| Date | Status | Borrower | Loan Amount |
|---|---|---|---|
| Open | Vilchis Richard | $369,900 | |
| Previous Owner | Sinkevicius Henrichas | $232,800 | |
| Previous Owner | Carter Carol | $95,000 |
Source: Public Records
Tax History Compared to Growth
Tax History
| Year | Tax Paid | Tax Assessment Tax Assessment Total Assessment is a certain percentage of the fair market value that is determined by local assessors to be the total taxable value of land and additions on the property. | Land | Improvement |
|---|---|---|---|---|
| 2024 | $3,945 | $29,000 | $15,497 | $13,503 |
| 2023 | $3,824 | $22,000 | $11,411 | $10,589 |
| 2022 | $3,824 | $22,000 | $11,411 | $10,589 |
| 2021 | $3,757 | $22,001 | $11,412 | $10,589 |
| 2020 | $4,502 | $23,299 | $6,487 | $16,812 |
| 2019 | $4,573 | $26,179 | $6,487 | $19,692 |
| 2018 | $4,495 | $26,179 | $6,487 | $19,692 |
| 2017 | $4,319 | $23,429 | $5,709 | $17,720 |
| 2016 | $4,195 | $23,429 | $5,709 | $17,720 |
| 2015 | $4,065 | $24,795 | $5,709 | $19,086 |
| 2014 | $3,480 | $21,310 | $5,190 | $16,120 |
| 2013 | $3,400 | $21,310 | $5,190 | $16,120 |
Source: Public Records
Map
Nearby Homes
- 1700 N Natoma Ave
- 1937 N Normandy Ave
- 1639 N Normandy Ave
- 1733 N Oak Park Ave
- 1627 N Narragansett Ave
- 1227 N East Ave
- 1221 Edmer Ave
- 1701 N Newland Ave
- 1104 Fair Oaks Ave
- 1212 N Harvey Ave
- 1600 N New England Ave Unit 4
- 1122 N Ridgeland Ave
- 1221 Hayes Ave
- 1715 N Meade Ave
- 1130 N Grove Ave
- 2311 N Natchez Ave
- 102 Le Moyne Pkwy
- 1618 N Mcvicker Ave
- 1905 N Nordica Ave
- 1625 N Mcvicker Ave
- 1818 N Natchez Ave
- 1812 N Natchez Ave
- 1820 N Natchez Ave
- 1808 N Natchez Ave
- 1824 N Natchez Ave
- 1804 N Natchez Ave
- 1828 N Natchez Ave
- 1830 N Natchez Ave
- 1832 N Natchez Ave
- 1817 N Nashville Ave
- 1811 N Nashville Ave
- 1819 N Nashville Ave
- 1809 N Nashville Ave
- 1823 N Nashville Ave
- 1836 N Natchez Ave
- 1807 N Nashville Ave
- 1805 N Nashville Ave
- 1829 N Nashville Ave
- 1840 N Natchez Ave
- 1801 N Nashville Ave