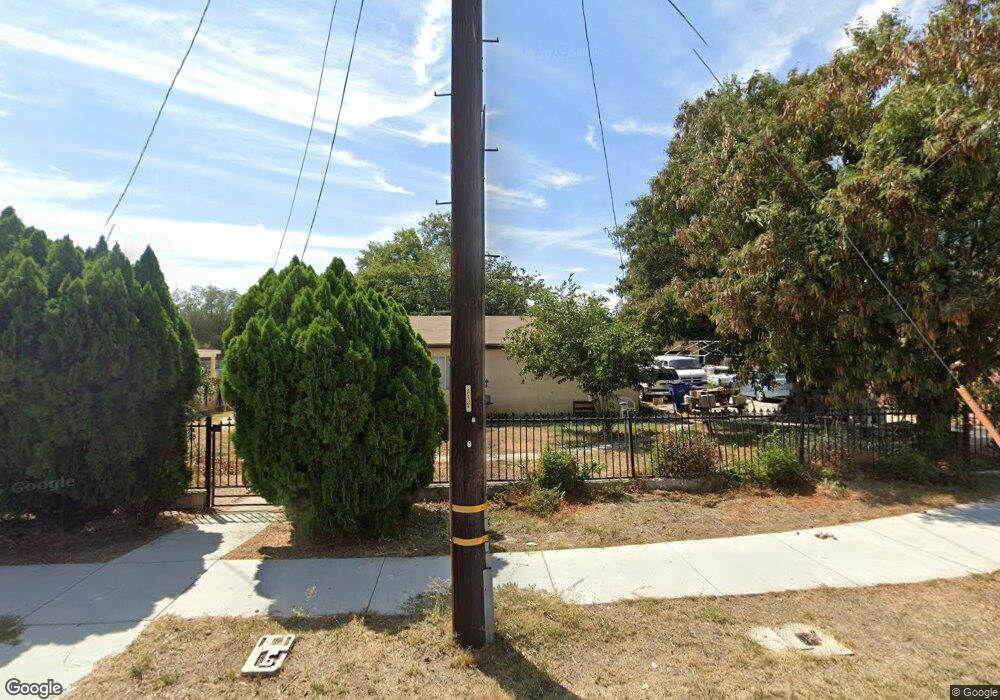
1816 S Magnolia Ave Ontario, CA 91762
Downtown Ontario NeighborhoodEstimated Value: $696,000 - $822,000
3
Beds
2
Baths
1,294
Sq Ft
$595/Sq Ft
Est. Value
About This Home
This home is located at 1816 S Magnolia Ave, Ontario, CA 91762 and is currently estimated at $769,551, approximately $594 per square foot. 1816 S Magnolia Ave is a home located in San Bernardino County with nearby schools including Vista Grande Elementary School, Oaks Middle, and Ontario High School.
Ownership History
Date
Name
Owned For
Owner Type
Purchase Details
Closed on
Nov 10, 2020
Sold by
Maria Eva Pareja Revocable Living Trust and Andrade-Pareja Brandon Allen
Bought by
Andrade-Pareja Brandon A
Current Estimated Value
Purchase Details
Closed on
Jun 26, 2017
Sold by
Pareja Eva
Bought by
The Maria Eva Pareja Revocable Living Tr
Purchase Details
Closed on
Mar 24, 2004
Sold by
Pareja Jesus
Bought by
Pareja Eva
Home Financials for this Owner
Home Financials are based on the most recent Mortgage that was taken out on this home.
Original Mortgage
$185,000
Interest Rate
5.76%
Mortgage Type
New Conventional
Purchase Details
Closed on
Feb 8, 1994
Sold by
Parks Rick D and Parks Cynthia D
Bought by
Pareja Jesus and Pareja Eva
Home Financials for this Owner
Home Financials are based on the most recent Mortgage that was taken out on this home.
Original Mortgage
$119,600
Interest Rate
7.24%
Create a Home Valuation Report for This Property
The Home Valuation Report is an in-depth analysis detailing your home's value as well as a comparison with similar homes in the area
Home Values in the Area
Average Home Value in this Area
Purchase History
| Date | Buyer | Sale Price | Title Company |
|---|---|---|---|
| Andrade-Pareja Brandon A | -- | None Listed On Document | |
| The Maria Eva Pareja Revocable Living Tr | -- | None Available | |
| Pareja Eva | -- | Chicago Title Co | |
| Pareja Jesus | $149,500 | Chicago Title Insurance |
Source: Public Records
Mortgage History
| Date | Status | Borrower | Loan Amount |
|---|---|---|---|
| Previous Owner | Pareja Eva | $185,000 | |
| Previous Owner | Pareja Jesus | $119,600 |
Source: Public Records
Tax History Compared to Growth
Tax History
| Year | Tax Paid | Tax Assessment Tax Assessment Total Assessment is a certain percentage of the fair market value that is determined by local assessors to be the total taxable value of land and additions on the property. | Land | Improvement |
|---|---|---|---|---|
| 2025 | $6,283 | $584,514 | $205,663 | $378,851 |
| 2024 | $6,283 | $573,053 | $201,630 | $371,423 |
| 2023 | $6,107 | $561,816 | $197,676 | $364,140 |
| 2022 | $6,027 | $550,800 | $193,800 | $357,000 |
| 2021 | $5,262 | $474,061 | $189,624 | $284,437 |
| 2020 | $2,799 | $259,809 | $139,869 | $119,940 |
| 2019 | $2,774 | $254,714 | $137,126 | $117,588 |
| 2018 | $2,734 | $249,719 | $134,437 | $115,282 |
| 2017 | $2,635 | $244,823 | $131,801 | $113,022 |
| 2016 | $2,530 | $240,023 | $129,217 | $110,806 |
| 2015 | $2,512 | $236,418 | $127,276 | $109,142 |
| 2014 | $2,433 | $231,787 | $124,783 | $107,004 |
Source: Public Records
Map
Nearby Homes
- 1726 S Mountain Ave Unit C
- 1712 S Mountain Ave Unit E
- 1604 S Mountain Ave Unit D
- 2064 S Magnolia Ave
- 1162 W Philadelphia St
- 1620 S Cypress Ave
- 926 W Philadelphia St Unit 49
- 926 W Philadelphia St Unit 18
- 926 W Philadelphia St Unit R99
- 926 W Philadelphia St Unit 10
- 2321 S Magnolia Ave Unit 6E
- 1546 Redwood Ave
- 6016 Harrison St
- 12321 Gardenia Place
- 11782 Vernon Ave
- 5500 Francis Ave
- 2022 S San Antonio Ave
- 5525 Dover St
- 1849 S San Antonio Ave
- 1209 S Palmetto Ave Unit C
- 1822 Magnolia Ave
- 1806 Magnolia Ave
- 1813 S Magnolia Ave
- 1803 S Magnolia Ave
- 1225 W Francis St
- 1840 Magnolia Ave
- 1823 Magnolia Ave
- 1830 S Magnolia Ave
- 1235 W Francis St
- 1760 Magnolia Ave
- 1839 Magnolia Ave
- 1850 S Magnolia Ave
- 1850 S Magnolia Ave
- 1761 Magnolia Ave
- 1228 W Francis St
- 1241 W Francis St
- 1755 Magnolia Ave
- 1740 Magnolia Ave
- 1121 W Francis St
- 1121 W Francis St Unit D