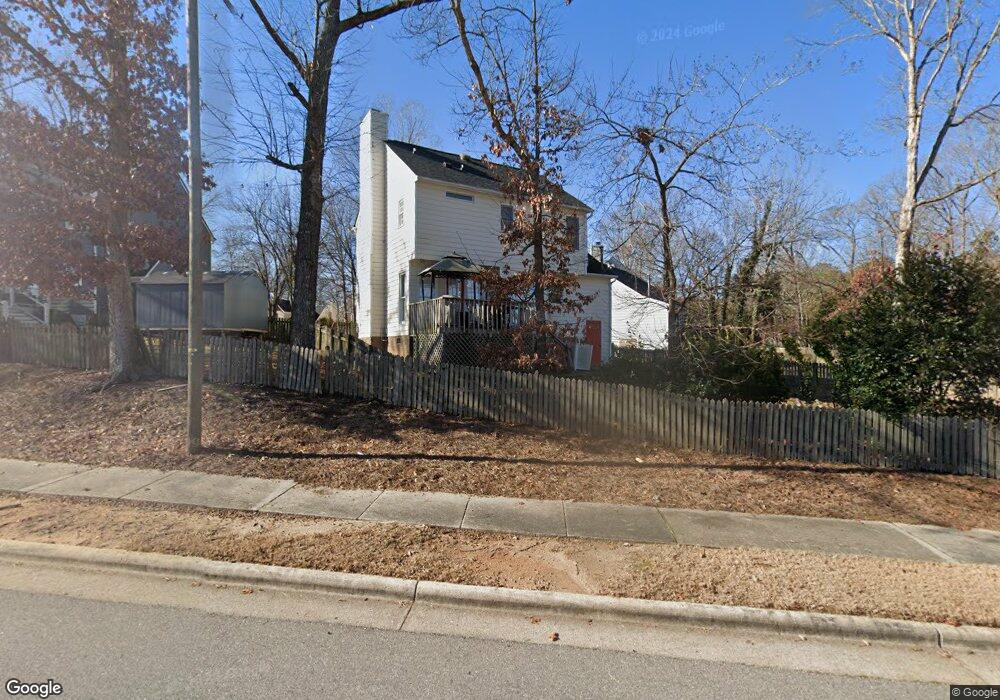
1816 Sagamore Ct Raleigh, NC 27604
Northeast Raleigh NeighborhoodEstimated Value: $332,993 - $340,000
3
Beds
3
Baths
1,469
Sq Ft
$230/Sq Ft
Est. Value
About This Home
This home is located at 1816 Sagamore Ct, Raleigh, NC 27604 and is currently estimated at $337,498, approximately $229 per square foot. 1816 Sagamore Ct is a home located in Wake County with nearby schools including Wilburn Elementary, Durant Road Middle, and Knightdale High.
Ownership History
Date
Name
Owned For
Owner Type
Purchase Details
Closed on
Mar 29, 2017
Sold by
Rosen Edward D and Rosen Ann K
Bought by
Butler Jeffrey and The Shirley T Warner Revocable Trust
Current Estimated Value
Purchase Details
Closed on
May 22, 2009
Sold by
Peacock Sharon and Peacock Joseph Brandon
Bought by
Willis Safiyya
Home Financials for this Owner
Home Financials are based on the most recent Mortgage that was taken out on this home.
Original Mortgage
$114,417
Interest Rate
4.81%
Mortgage Type
FHA
Purchase Details
Closed on
Jun 8, 2005
Sold by
Ogden Roger V
Bought by
Ogden Sharon K
Home Financials for this Owner
Home Financials are based on the most recent Mortgage that was taken out on this home.
Original Mortgage
$119,500
Interest Rate
5.5%
Mortgage Type
Fannie Mae Freddie Mac
Purchase Details
Closed on
Feb 10, 1999
Sold by
Johnson Peter A
Bought by
Ogden Roger and Ogden Sharon K
Home Financials for this Owner
Home Financials are based on the most recent Mortgage that was taken out on this home.
Original Mortgage
$118,919
Interest Rate
6.79%
Mortgage Type
FHA
Create a Home Valuation Report for This Property
The Home Valuation Report is an in-depth analysis detailing your home's value as well as a comparison with similar homes in the area
Home Values in the Area
Average Home Value in this Area
Purchase History
| Date | Buyer | Sale Price | Title Company |
|---|---|---|---|
| Butler Jeffrey | $382,000 | None Available | |
| Willis Safiyya | $135,000 | None Available | |
| Ogden Sharon K | -- | None Available | |
| Ogden Roger | $120,000 | -- |
Source: Public Records
Mortgage History
| Date | Status | Borrower | Loan Amount |
|---|---|---|---|
| Previous Owner | Willis Safiyya | $114,417 | |
| Previous Owner | Ogden Sharon K | $119,500 | |
| Previous Owner | Ogden Roger | $118,919 |
Source: Public Records
Tax History Compared to Growth
Tax History
| Year | Tax Paid | Tax Assessment Tax Assessment Total Assessment is a certain percentage of the fair market value that is determined by local assessors to be the total taxable value of land and additions on the property. | Land | Improvement |
|---|---|---|---|---|
| 2025 | $2,596 | $295,431 | $100,000 | $195,431 |
| 2024 | $2,586 | $295,431 | $100,000 | $195,431 |
| 2023 | $2,177 | $197,914 | $55,000 | $142,914 |
| 2022 | $2,024 | $197,914 | $55,000 | $142,914 |
| 2021 | $1,946 | $197,914 | $55,000 | $142,914 |
| 2020 | $1,910 | $197,914 | $55,000 | $142,914 |
| 2019 | $1,725 | $147,103 | $38,000 | $109,103 |
| 2018 | $1,627 | $147,103 | $38,000 | $109,103 |
| 2017 | $1,550 | $147,103 | $38,000 | $109,103 |
| 2016 | $1,519 | $147,103 | $38,000 | $109,103 |
| 2015 | $1,533 | $146,105 | $38,000 | $108,105 |
| 2014 | $1,454 | $146,105 | $38,000 | $108,105 |
Source: Public Records
Map
Nearby Homes
- 4401 Liverpool Ln
- 4945 Liverpool Ln
- 1559 Crescent Townes Way
- Savannah Plan at Crescent Townes
- 1510 Crescent Townes Way
- 1508 Crescent Townes Way
- 1506 Crescent Townes Way
- 1504 Crescent Townes Way
- 1502 Crescent Townes Way
- 1500 Crescent Townes Way
- 1505 Crescent Townes Way
- 1503 Crescent Townes Way
- 1501 Crescent Townes Way
- 2037 Summer Shire Way
- 4733 Royal Troon Dr
- 4608 Mowbray Dr
- 1713 Kingston Heath Way
- 4656 Forest Highland Dr
- 2109 Woodwyck Way
- 1744 Kingston Heath Way
- 1820 Sagamore Ct
- 1812 Sagamore Ct
- 1825 Sagamore Ct
- 1808 Sagamore Ct
- 1821 Sagamore Ct
- 1804 Sagamore Ct
- 4716 Dillingham Ct
- 1817 Sagamore Ct
- 4712 Dillingham Ct
- 1813 Sagamore Ct
- 1800 Sagamore Ct
- 4720 Dillingham Ct
- 1809 Sagamore Ct
- 4708 Dillingham Ct
- 1805 Sagamore Ct
- 1728 Sagamore Ct
- 4801 Liverpool Ln
- 4704 Dillingham Ct
- 4805 Liverpool Ln
- 4721 Dillingham Ct