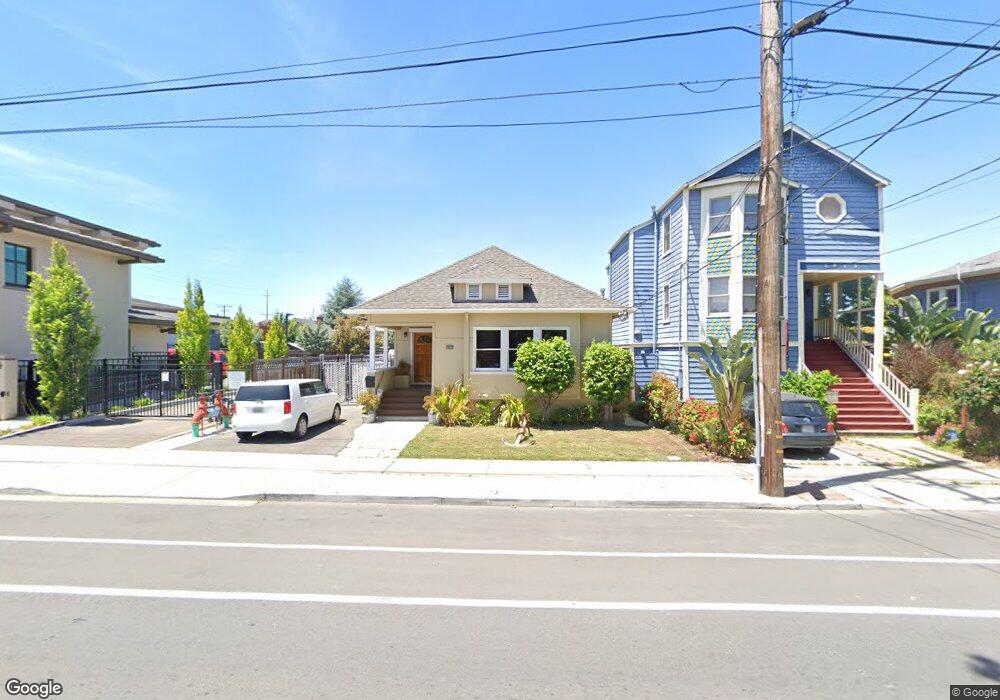
1817 Grand St Alameda, CA 94501
West Alameda NeighborhoodEstimated Value: $1,023,000 - $1,180,000
3
Beds
1
Bath
1,311
Sq Ft
$818/Sq Ft
Est. Value
About This Home
This home is located at 1817 Grand St, Alameda, CA 94501 and is currently estimated at $1,072,766, approximately $818 per square foot. 1817 Grand St is a home located in Alameda County with nearby schools including Maya Lin School, Will C. Wood Middle School, and Encinal Junior/Senior High.
Ownership History
Date
Name
Owned For
Owner Type
Purchase Details
Closed on
Jan 30, 2017
Sold by
Fuller William and Fuller Donalynne A
Bought by
Lindemann Henry C and Henry C Lindemann Revocable Tr
Current Estimated Value
Home Financials for this Owner
Home Financials are based on the most recent Mortgage that was taken out on this home.
Original Mortgage
$250,000
Outstanding Balance
$207,566
Interest Rate
4.3%
Mortgage Type
Purchase Money Mortgage
Estimated Equity
$865,200
Purchase Details
Closed on
Nov 22, 2004
Sold by
Arstill Barbara and The Kathryn J Hallett Living T
Bought by
Fuller William and Fuller Donalynne A
Home Financials for this Owner
Home Financials are based on the most recent Mortgage that was taken out on this home.
Original Mortgage
$100,000
Interest Rate
5.25%
Mortgage Type
Purchase Money Mortgage
Purchase Details
Closed on
Oct 14, 2002
Sold by
Hallett Kathryn J
Bought by
Hallett Kathryn J and The Kathryn J Hallett Living T
Create a Home Valuation Report for This Property
The Home Valuation Report is an in-depth analysis detailing your home's value as well as a comparison with similar homes in the area
Home Values in the Area
Average Home Value in this Area
Purchase History
| Date | Buyer | Sale Price | Title Company |
|---|---|---|---|
| Lindemann Henry C | $825,000 | Fidelity National Title Co | |
| Fuller William | $475,000 | First American Title Co | |
| Hallett Kathryn J | -- | -- |
Source: Public Records
Mortgage History
| Date | Status | Borrower | Loan Amount |
|---|---|---|---|
| Open | Lindemann Henry C | $250,000 | |
| Previous Owner | Fuller William | $100,000 | |
| Closed | Fuller William | $200,000 |
Source: Public Records
Tax History Compared to Growth
Tax History
| Year | Tax Paid | Tax Assessment Tax Assessment Total Assessment is a certain percentage of the fair market value that is determined by local assessors to be the total taxable value of land and additions on the property. | Land | Improvement |
|---|---|---|---|---|
| 2025 | $8,567 | $621,850 | $369,665 | $259,185 |
| 2024 | $8,567 | $609,520 | $362,417 | $254,103 |
| 2023 | $8,982 | $604,435 | $355,313 | $249,122 |
| 2022 | $8,782 | $585,583 | $348,346 | $244,237 |
| 2021 | $8,568 | $573,965 | $341,516 | $239,449 |
| 2020 | $8,463 | $575,009 | $338,015 | $236,994 |
| 2019 | $8,005 | $563,737 | $331,389 | $232,348 |
| 2018 | $7,805 | $552,688 | $324,894 | $227,794 |
| 2017 | $7,854 | $570,465 | $168,137 | $402,328 |
| 2016 | $7,862 | $559,283 | $164,841 | $394,442 |
| 2015 | $7,837 | $550,885 | $162,366 | $388,519 |
| 2014 | $7,482 | $540,098 | $159,187 | $380,911 |
Source: Public Records
Map
Nearby Homes
- 1665 Ellen Craig Ave
- 1661 Ave
- 1933 Grand St
- 1670 Larkspur St
- 1662 Larkspur St
- 1937 Grand St
- 1660 Clement Ave
- Residence 4 Plan at Skyline
- Residence 1 Plan at Skyline
- Residence 3 Plan at Skyline
- Residence 5 Plan at Skyline
- Residence 2 Plan at Skyline
- 1707 Lincoln Ave
- 1613 Union St
- 1805 Eagle Ave
- 1572 Lincoln Ave
- 1613 Stanton St
- 1815 Balsa St
- 1711 Arbor St
- 1523 Lincoln Ave
- 1819 Grand St
- 1821 Grand St
- 1829 Grand St
- 1816 Hibbard St
- 1820 Hibbard St
- 1814 Hibbard St
- 1824 Hibbard St
- 1810 Hibbard St
- 1635 Buena Vista Ave
- 1801 Grand St
- 1816 Grand St
- 1814 Grand St
- 1633 Eagle Ave
- 1635 Eagle Ave
- 1631 Eagle Ave
- 1637 Eagle Ave
- 1806 Grand St
- 1629 Eagle Ave
- 1627 Eagle Ave
- 1802 Grand St