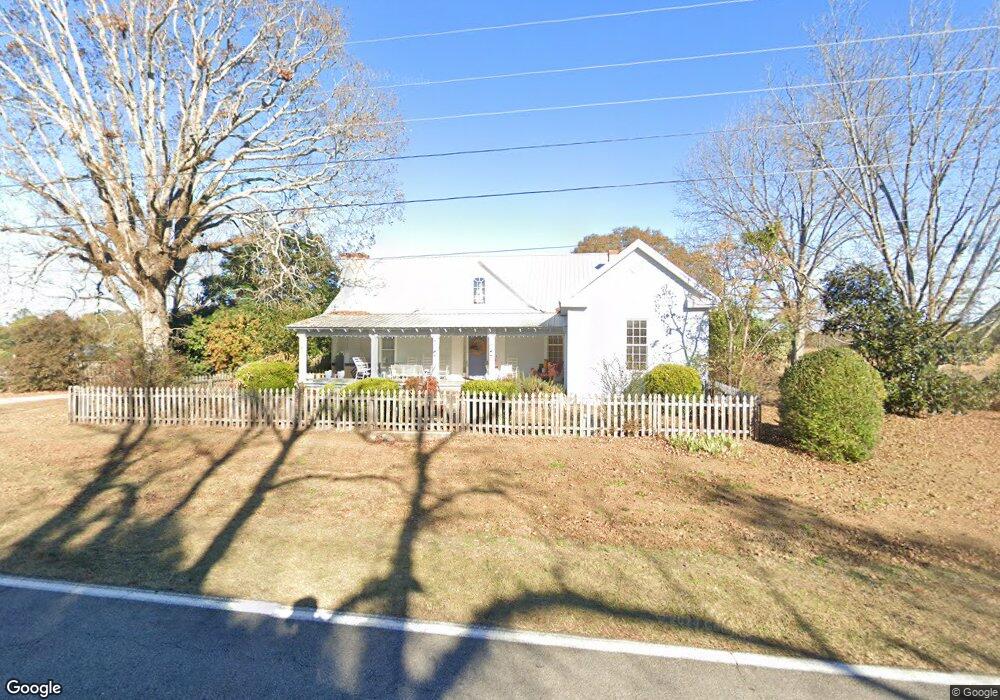
1817 Hopewell Church Rd Pine Mountain, GA 31822
Estimated Value: $353,000 - $542,000
4
Beds
3
Baths
3,105
Sq Ft
$134/Sq Ft
Est. Value
About This Home
This home is located at 1817 Hopewell Church Rd, Pine Mountain, GA 31822 and is currently estimated at $416,025, approximately $133 per square foot. 1817 Hopewell Church Rd is a home located in Harris County with nearby schools including Park Elementary School, Harris County Carver Middle School, and Harris County High School.
Ownership History
Date
Name
Owned For
Owner Type
Purchase Details
Closed on
Mar 8, 2019
Sold by
Short Barbara Burgess
Bought by
Ford Paige E and Ford Martin
Current Estimated Value
Home Financials for this Owner
Home Financials are based on the most recent Mortgage that was taken out on this home.
Original Mortgage
$167,500
Outstanding Balance
$147,261
Interest Rate
4.4%
Mortgage Type
New Conventional
Estimated Equity
$268,764
Purchase Details
Closed on
Aug 23, 2016
Sold by
Barbara B
Bought by
Riquier Gerald A and Riquier Patricia A
Purchase Details
Closed on
Jun 24, 2015
Sold by
Barbara B
Bought by
Hall Theresia Ulrika
Purchase Details
Closed on
Mar 1, 2006
Sold by
Short J B
Bought by
Short J B J and Short Barbara B
Purchase Details
Closed on
Feb 13, 2006
Sold by
Short J B
Bought by
Short Barbara B
Purchase Details
Closed on
Aug 31, 2001
Bought by
Short J B
Create a Home Valuation Report for This Property
The Home Valuation Report is an in-depth analysis detailing your home's value as well as a comparison with similar homes in the area
Home Values in the Area
Average Home Value in this Area
Purchase History
| Date | Buyer | Sale Price | Title Company |
|---|---|---|---|
| Ford Paige E | -- | -- | |
| Riquier Gerald A | $97,690 | -- | |
| Hall Theresia Ulrika | -- | -- | |
| Short J B J | -- | -- | |
| Short Barbara B | -- | -- | |
| Short J B | -- | -- |
Source: Public Records
Mortgage History
| Date | Status | Borrower | Loan Amount |
|---|---|---|---|
| Open | Ford Paige E | $167,500 |
Source: Public Records
Tax History Compared to Growth
Tax History
| Year | Tax Paid | Tax Assessment Tax Assessment Total Assessment is a certain percentage of the fair market value that is determined by local assessors to be the total taxable value of land and additions on the property. | Land | Improvement |
|---|---|---|---|---|
| 2024 | $1,695 | $67,966 | $25,838 | $42,128 |
| 2023 | $1,689 | $67,966 | $25,838 | $42,128 |
| 2022 | $1,683 | $67,966 | $25,838 | $42,128 |
| 2021 | $1,781 | $69,831 | $25,838 | $43,993 |
| 2020 | $1,775 | $69,831 | $25,838 | $43,993 |
| 2019 | $1,716 | $69,831 | $25,838 | $43,993 |
| 2018 | $2,212 | $119,765 | $68,753 | $51,012 |
| 2017 | $2,158 | $99,889 | $48,877 | $51,012 |
| 2016 | $1,651 | $184,243 | $137,741 | $46,502 |
| 2015 | $1,639 | $184,243 | $137,741 | $46,502 |
| 2014 | $1,629 | $184,243 | $137,741 | $46,502 |
| 2013 | -- | $184,242 | $137,740 | $46,502 |
Source: Public Records
Map
Nearby Homes
- 31 Eight Point Ct
- 1553 Hopewell Church Rd
- 4043 Piedmont Lake Rd
- LOT 159 PH1 SEC Piedmont Lake Rd
- 185 Hopkins Rd
- 0 Hopkins Rd Unit 221621
- 2689 Piedmont Lake Rd
- 2547 Piedmont Lake Rd
- Lot 159 Ph1Sec2 Piedmont Lake Rd
- 3098 Piedmont Lake Rd
- 0 Hopewell Church Rd Unit 10543905
- 0 Hopewell Church Rd Unit 10543900
- 0 Hopewell Church Rd Unit 10543897
- 0 Hopewell Church Rd Unit 221622
- 0 Hopewell Church Rd Unit 221620
- 14188 Ga Highway 219
- 186 Beech Springs Rd
- 8705 Georgia 18
- 8705 Ga Highway 18
- 120 Chinaberry St
- 1947 Hopewell Church Rd
- 1948 Hopewell Church Rd
- 256 Price Rd
- 253 Price Rd
- 4 Eight Point Ct
- 68 Eight Point Ct
- 70 Lynda Ln
- 76 Eight Point Ct
- 34 Eight Point Ct
- 20 Lynda Ln
- 0 Lynda Ln Unit 8355134
- 0 Lynda Ln Unit 7390914
- 0 Lynda Ln Unit 7256240
- 0 Lynda Ln
- 1679 Hopewell Church Rd
- 120 Lynda Ln
- 152 Lynda Ln
- 116 Whitetail Way
- 75 Lynda Ln
- 55 Eight Point Ct