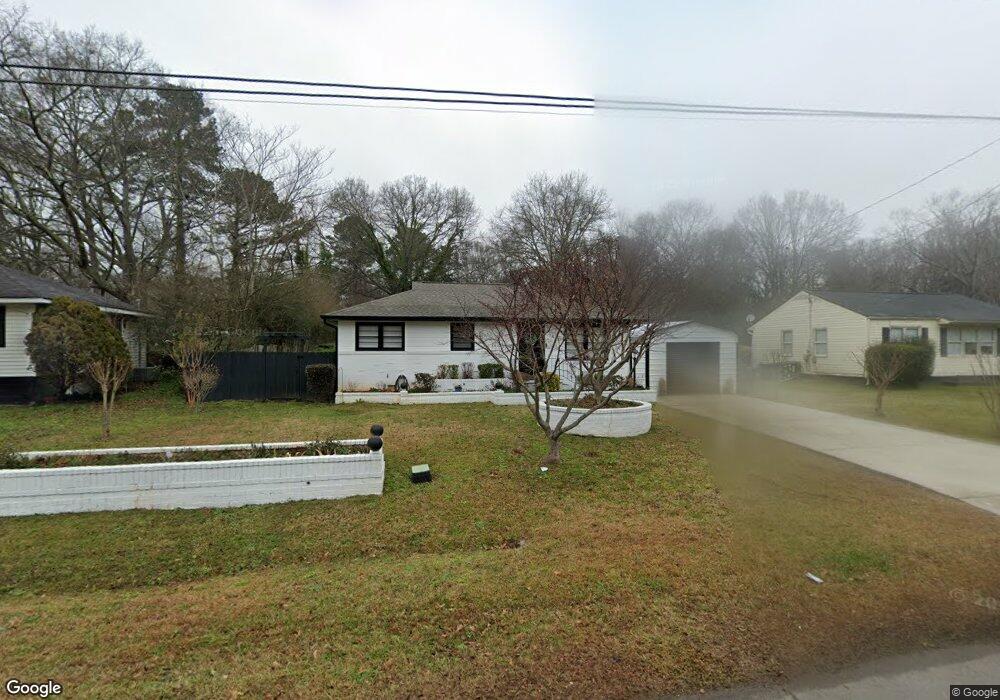
1817 Judy Cir SE Marietta, GA 30060
Southwestern Marietta NeighborhoodEstimated Value: $254,653 - $279,000
3
Beds
1
Bath
1,396
Sq Ft
$192/Sq Ft
Est. Value
About This Home
This home is located at 1817 Judy Cir SE, Marietta, GA 30060 and is currently estimated at $268,413, approximately $192 per square foot. 1817 Judy Cir SE is a home located in Cobb County with nearby schools including Fair Oaks Elementary School, Osborne High School, and International Academy of Smyrna.
Ownership History
Date
Name
Owned For
Owner Type
Purchase Details
Closed on
Oct 15, 2018
Sold by
Arellano Tiodoro
Bought by
Arellano Ma Victoria Correa
Current Estimated Value
Purchase Details
Closed on
Aug 22, 2008
Sold by
By Benjamin J
Bought by
Arellano Tiodoro
Home Financials for this Owner
Home Financials are based on the most recent Mortgage that was taken out on this home.
Original Mortgage
$65,900
Interest Rate
6.61%
Mortgage Type
New Conventional
Purchase Details
Closed on
Aug 31, 2006
Sold by
Oenning James A and Oenning Lisa L
Bought by
Oenning Invest Props Inc
Purchase Details
Closed on
Aug 7, 2001
Sold by
Hollans Sonya D
Bought by
Juarez Benjamin and Ma Del R
Home Financials for this Owner
Home Financials are based on the most recent Mortgage that was taken out on this home.
Original Mortgage
$89,750
Interest Rate
7.1%
Mortgage Type
New Conventional
Create a Home Valuation Report for This Property
The Home Valuation Report is an in-depth analysis detailing your home's value as well as a comparison with similar homes in the area
Home Values in the Area
Average Home Value in this Area
Purchase History
| Date | Buyer | Sale Price | Title Company |
|---|---|---|---|
| Arellano Ma Victoria Correa | -- | -- | |
| Arellano Tiodoro | $82,400 | -- | |
| Oenning Invest Props Inc | -- | -- | |
| Juarez Benjamin | $94,500 | -- |
Source: Public Records
Mortgage History
| Date | Status | Borrower | Loan Amount |
|---|---|---|---|
| Previous Owner | Arellano Tiodoro | $65,900 | |
| Previous Owner | Juarez Benjamin | $89,750 |
Source: Public Records
Tax History Compared to Growth
Tax History
| Year | Tax Paid | Tax Assessment Tax Assessment Total Assessment is a certain percentage of the fair market value that is determined by local assessors to be the total taxable value of land and additions on the property. | Land | Improvement |
|---|---|---|---|---|
| 2025 | $2,047 | $92,256 | $16,000 | $76,256 |
| 2024 | $2,049 | $92,256 | $16,000 | $76,256 |
| 2023 | $1,507 | $92,256 | $16,000 | $76,256 |
| 2022 | $1,725 | $76,672 | $16,000 | $60,672 |
| 2021 | $1,223 | $53,776 | $20,000 | $33,776 |
| 2020 | $1,067 | $46,612 | $10,000 | $36,612 |
| 2019 | $1,067 | $46,612 | $10,000 | $36,612 |
| 2018 | $1,148 | $37,812 | $10,000 | $27,812 |
| 2017 | $1,087 | $37,812 | $10,000 | $27,812 |
| 2016 | $752 | $26,172 | $6,000 | $20,172 |
| 2015 | $771 | $26,172 | $6,000 | $20,172 |
| 2014 | $695 | $23,388 | $0 | $0 |
Source: Public Records
Map
Nearby Homes
- 1819 Judy Cir SE
- 1821 Judy Cir SE
- 1847 Olive Springs Rd SE
- 1813 Judy Cir SE
- 1832 Judy Cir SE
- 1823 Judy Cir SE
- 1878 Casey Dr SE
- 1830 Judy Cir SE
- 1828 Judy Cir SE
- 0 Casey Dr SE Unit 7378351
- 1825 Judy Cir SE
- 1826 Judy Cir SE
- 1884 Casey Dr SE
- 1850 Olive Springs Rd SE
- 1827 Judy Cir SE
- 1840 Olive Springs Rd SE
- 1805 Olive Springs Rd SE
- 1860 Olive Springs Rd SE
- 1865 Casey Dr SE
- 1836 Judy Cir SE