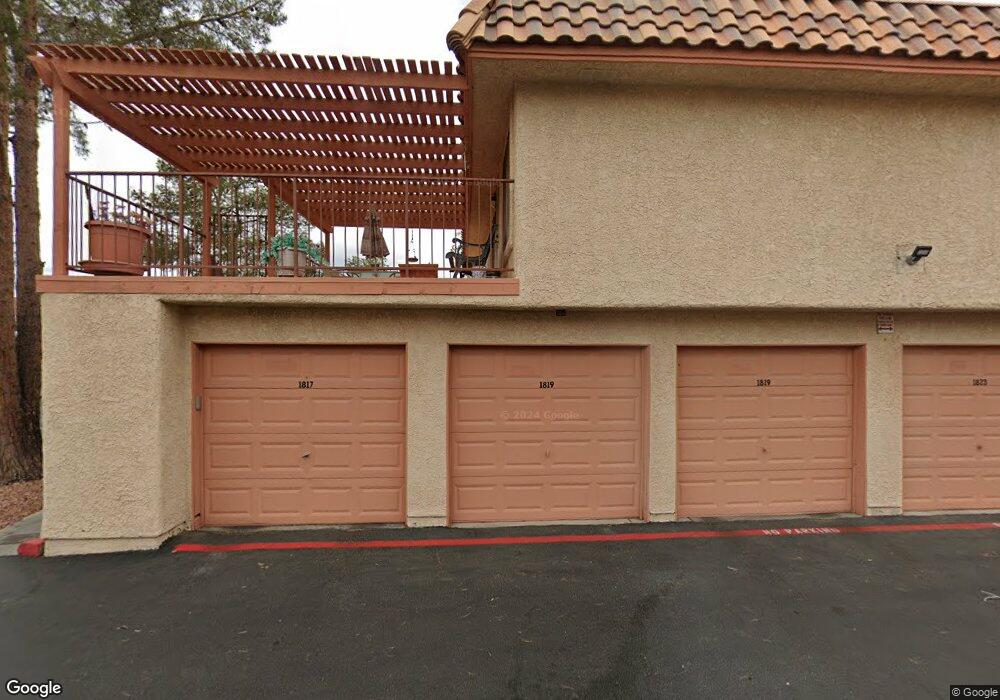
1817 Plum Ct Unit D Henderson, NV 89014
Green Valley North NeighborhoodEstimated Value: $238,314 - $256,000
2
Beds
2
Baths
924
Sq Ft
$267/Sq Ft
Est. Value
About This Home
This home is located at 1817 Plum Ct Unit D, Henderson, NV 89014 and is currently estimated at $246,829, approximately $267 per square foot. 1817 Plum Ct Unit D is a home located in Clark County with nearby schools including Harriet Treem Elementary School, Jim Thorpe Elementary School, and Francis H Cortney Junior High School.
Ownership History
Date
Name
Owned For
Owner Type
Purchase Details
Closed on
Sep 28, 2016
Sold by
Buck Carole A
Bought by
The Carole Ann Buck Revocable Trust
Current Estimated Value
Purchase Details
Closed on
Dec 21, 2004
Sold by
Buck Carole Ann
Bought by
Buck Carole A
Home Financials for this Owner
Home Financials are based on the most recent Mortgage that was taken out on this home.
Original Mortgage
$101,174
Outstanding Balance
$49,449
Interest Rate
5.37%
Mortgage Type
New Conventional
Estimated Equity
$197,380
Purchase Details
Closed on
Sep 10, 2003
Sold by
Law Rhonda Rochelle
Bought by
Buck Carole Ann
Home Financials for this Owner
Home Financials are based on the most recent Mortgage that was taken out on this home.
Original Mortgage
$99,750
Interest Rate
6.17%
Mortgage Type
Unknown
Purchase Details
Closed on
Sep 27, 1994
Sold by
Branca Sandra M
Bought by
Law Rhonda Rochelle
Home Financials for this Owner
Home Financials are based on the most recent Mortgage that was taken out on this home.
Original Mortgage
$71,500
Interest Rate
8.58%
Mortgage Type
FHA
Create a Home Valuation Report for This Property
The Home Valuation Report is an in-depth analysis detailing your home's value as well as a comparison with similar homes in the area
Home Values in the Area
Average Home Value in this Area
Purchase History
| Date | Buyer | Sale Price | Title Company |
|---|---|---|---|
| The Carole Ann Buck Revocable Trust | -- | None Available | |
| Buck Carole A | -- | Chicago Title | |
| Buck Carole Ann | $105,000 | First American Title Co | |
| Law Rhonda Rochelle | $74,000 | United Title |
Source: Public Records
Mortgage History
| Date | Status | Borrower | Loan Amount |
|---|---|---|---|
| Open | Buck Carole A | $101,174 | |
| Closed | Buck Carole Ann | $99,750 | |
| Previous Owner | Law Rhonda Rochelle | $71,500 |
Source: Public Records
Tax History Compared to Growth
Tax History
| Year | Tax Paid | Tax Assessment Tax Assessment Total Assessment is a certain percentage of the fair market value that is determined by local assessors to be the total taxable value of land and additions on the property. | Land | Improvement |
|---|---|---|---|---|
| 2025 | $564 | $51,273 | $21,350 | $29,923 |
| 2024 | $548 | $51,273 | $21,350 | $29,923 |
| 2023 | $548 | $52,299 | $24,500 | $27,799 |
| 2022 | $532 | $45,592 | $19,005 | $26,587 |
| 2021 | $516 | $39,935 | $17,500 | $22,435 |
| 2020 | $498 | $40,974 | $17,500 | $23,474 |
| 2019 | $484 | $37,486 | $14,000 | $23,486 |
| 2018 | $470 | $31,543 | $8,750 | $22,793 |
| 2017 | $859 | $29,643 | $6,650 | $22,993 |
| 2016 | $446 | $27,781 | $5,600 | $22,181 |
| 2015 | $444 | $22,992 | $3,850 | $19,142 |
| 2014 | $431 | $14,438 | $3,500 | $10,938 |
Source: Public Records
Map
Nearby Homes
- 1843 Mimosa Ct
- 1818 Somersby Way
- 1823 Rapier Dr Unit 1823
- 1808 Michael Ct
- 1804 Michael Ct
- 1939 Cutlass Dr Unit 92
- 1947 Cutlass Dr Unit 88
- 1979 Cutlass Dr Unit 72
- 572 Cervantes Dr
- 1723 Comstock Dr
- 844 Flowing Meadow Dr
- 615 Cervantes Dr
- 2695 Dulcinea Dr
- 1701 Comstock Dr
- 1700 Empire Mine Dr
- 505 Meadbury Dr
- 1699 Sonoran Bluff Ave
- 426 Lost Trail Dr
- 1947 Sundown Canyon Dr
- 2416 Greens Ave
- 1819 Plum Ct
- 1823 Plum Ct
- 1821 Plum Ct
- 1831 Plum Ct
- 1825 Plum Ct Unit A
- 1827 Plum Ct Unit B
- 1829 Plum Ct
- 1810 Plum Ct
- 1812 Plum Ct
- 1814 Plum Ct Unit B
- 1822 Plum Ct
- 1820 Plum Ct
- 1824 Plum Ct
- 1818 Plum Ct
- 1824 Plum Ct Unit D
- 1816 Plum Ct Unit A
- 1809 Plum Ct
- 1809 Plum Ct Unit D
- 1811 Plum Ct
- 1811 Plum Ct Unit C