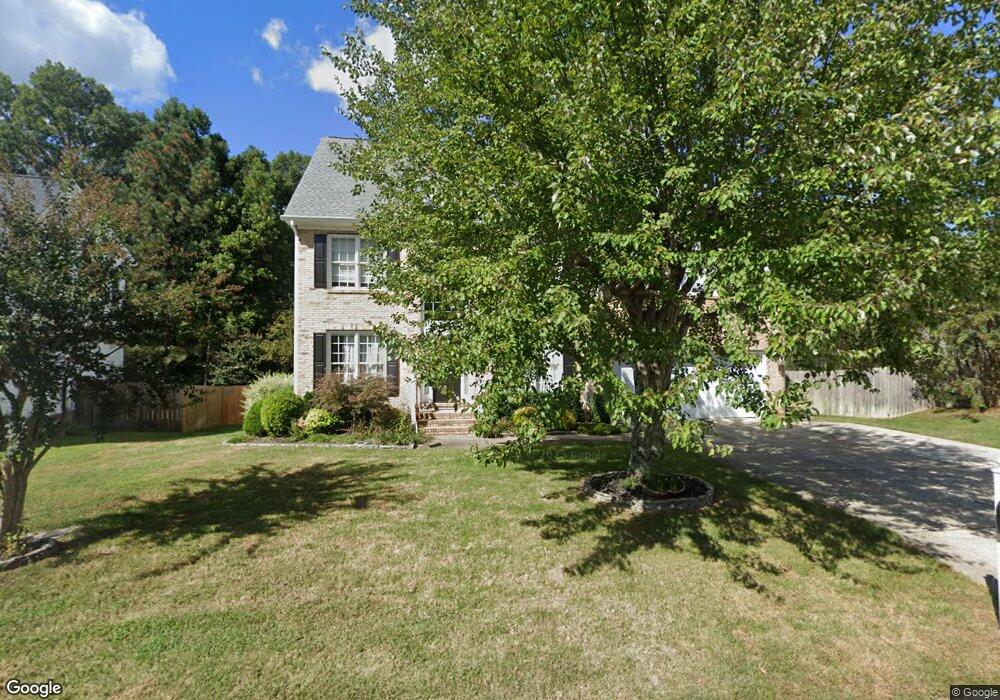
1817 Turning Leaf Ln Durham, NC 27712
North Durham NeighborhoodEstimated Value: $588,502 - $626,000
5
Beds
3
Baths
3,064
Sq Ft
$196/Sq Ft
Est. Value
About This Home
This home is located at 1817 Turning Leaf Ln, Durham, NC 27712 and is currently estimated at $600,876, approximately $196 per square foot. 1817 Turning Leaf Ln is a home located in Durham County with nearby schools including Eno Valley Elementary, George L Carrington Middle, and Northern High School.
Ownership History
Date
Name
Owned For
Owner Type
Purchase Details
Closed on
May 17, 2019
Sold by
Mantell Ralph Michael and Mantell Janet
Bought by
Deleon Emily Nelson and Deleon Anthony Khedron
Current Estimated Value
Home Financials for this Owner
Home Financials are based on the most recent Mortgage that was taken out on this home.
Original Mortgage
$342,000
Outstanding Balance
$301,711
Interest Rate
4.37%
Mortgage Type
Adjustable Rate Mortgage/ARM
Estimated Equity
$299,165
Purchase Details
Closed on
Feb 15, 2001
Sold by
St Lawrence Homes Inc
Bought by
Mantell Ralph Michael and Mantell Janet
Home Financials for this Owner
Home Financials are based on the most recent Mortgage that was taken out on this home.
Original Mortgage
$241,950
Interest Rate
7.12%
Create a Home Valuation Report for This Property
The Home Valuation Report is an in-depth analysis detailing your home's value as well as a comparison with similar homes in the area
Home Values in the Area
Average Home Value in this Area
Purchase History
| Date | Buyer | Sale Price | Title Company |
|---|---|---|---|
| Deleon Emily Nelson | $380,000 | None Available | |
| Mantell Ralph Michael | $255,000 | -- |
Source: Public Records
Mortgage History
| Date | Status | Borrower | Loan Amount |
|---|---|---|---|
| Open | Deleon Emily Nelson | $342,000 | |
| Previous Owner | Mantell Ralph Michael | $241,950 |
Source: Public Records
Tax History
| Year | Tax Paid | Tax Assessment Tax Assessment Total Assessment is a certain percentage of the fair market value that is determined by local assessors to be the total taxable value of land and additions on the property. | Land | Improvement |
|---|---|---|---|---|
| 2025 | $5,608 | $565,729 | $81,250 | $484,479 |
| 2024 | $4,815 | $345,216 | $55,250 | $289,966 |
| 2023 | $4,522 | $345,173 | $55,207 | $289,966 |
| 2022 | $4,227 | $330,226 | $55,207 | $275,019 |
| 2021 | $4,207 | $330,226 | $55,207 | $275,019 |
| 2020 | $4,108 | $330,226 | $55,207 | $275,019 |
| 2019 | $4,108 | $330,226 | $55,207 | $275,019 |
| 2018 | $3,877 | $285,802 | $45,465 | $240,337 |
| 2017 | $3,848 | $285,802 | $45,465 | $240,337 |
| 2016 | $3,719 | $285,802 | $45,465 | $240,337 |
| 2015 | $3,957 | $285,868 | $57,941 | $227,927 |
| 2014 | $3,957 | $285,868 | $57,941 | $227,927 |
Source: Public Records
Map
Nearby Homes
- 204 Accura Ct
- 1708 Mystic Dr
- 1621 Bramble Dr
- 4518 Paces Ferry Dr
- 411 Latta Cir
- 5324 Fairoaks Rd
- 405 Latta Rd
- 5610 Genesee Dr
- 1303 Imperial Dr
- 5022 Green Oak Dr
- 9 Otters Run
- 5005 Gatewood Dr
- 1113 Umstead Grove Way
- 5406 Ripplebrook Dr
- 5857 Genesee Dr
- 5120 Raintree Rd
- 5502 Ripplebrook Rd
- 5820 Genesee Dr
- 5620 Birch Dr
- 1109 Prominence Dr
- 1815 Turning Leaf Ln
- 1901 Yellowood Ln
- 1903 Yellowood Ln
- 1901 Yellowwood Ln
- 1813 Turning Leaf Ln
- 1816 Turning Leaf Ln
- 1809 Yellowood Ln
- 1905 Yellowood Ln
- 1818 Turning Leaf Ln
- 1814 Turning Leaf Ln
- 1811 Turning Leaf Ln
- 1902 Yellowwood Ln
- 1904 Yellowwood Ln
- 1812 Turning Leaf Ln
- 1902 Yellowood Ln
- 1909 Yellowood Ln
- 1805 Yellowood Ln
- 1904 Yellowood Ln
- 1909 Yellowwood Ln
- 1808 Yellowood Ln
Your Personal Tour Guide
Ask me questions while you tour the home.