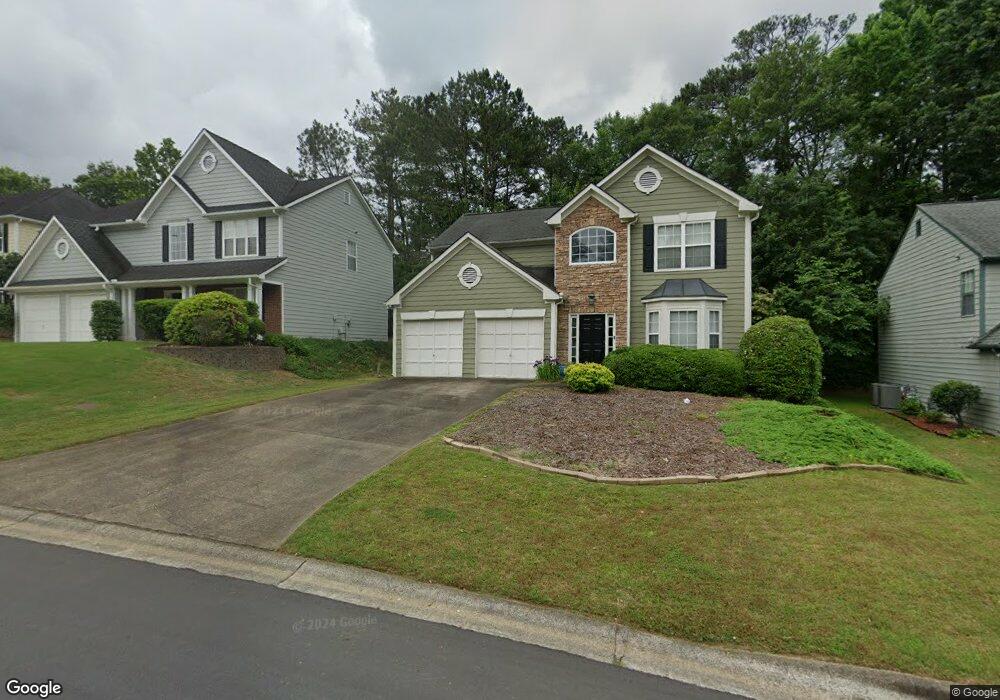
1818 Chasewood Park Dr Marietta, GA 30066
Sandy Plains NeighborhoodEstimated Value: $411,629 - $452,000
3
Beds
3
Baths
2,132
Sq Ft
$204/Sq Ft
Est. Value
About This Home
This home is located at 1818 Chasewood Park Dr, Marietta, GA 30066 and is currently estimated at $434,907, approximately $203 per square foot. 1818 Chasewood Park Dr is a home located in Cobb County with nearby schools including Addison Elementary School, Daniell Middle School, and Sprayberry High School.
Ownership History
Date
Name
Owned For
Owner Type
Purchase Details
Closed on
Oct 14, 2004
Sold by
Turner Sharon M
Bought by
Hudson Bonnie B
Current Estimated Value
Home Financials for this Owner
Home Financials are based on the most recent Mortgage that was taken out on this home.
Original Mortgage
$148,665
Outstanding Balance
$72,470
Interest Rate
5.64%
Mortgage Type
New Conventional
Estimated Equity
$362,437
Purchase Details
Closed on
Jul 12, 2002
Sold by
Chandler Ltd
Bought by
Turner Sharon M
Home Financials for this Owner
Home Financials are based on the most recent Mortgage that was taken out on this home.
Original Mortgage
$141,600
Interest Rate
6.67%
Mortgage Type
New Conventional
Purchase Details
Closed on
Apr 29, 2002
Sold by
Lizee Lance P
Bought by
Chandler Ltd
Purchase Details
Closed on
Dec 22, 1997
Sold by
Macgregor Paul R
Bought by
Lizee Lance P
Home Financials for this Owner
Home Financials are based on the most recent Mortgage that was taken out on this home.
Original Mortgage
$118,000
Interest Rate
7.23%
Mortgage Type
New Conventional
Create a Home Valuation Report for This Property
The Home Valuation Report is an in-depth analysis detailing your home's value as well as a comparison with similar homes in the area
Home Values in the Area
Average Home Value in this Area
Purchase History
| Date | Buyer | Sale Price | Title Company |
|---|---|---|---|
| Hudson Bonnie B | $186,000 | -- | |
| Turner Sharon M | $177,000 | -- | |
| Chandler Ltd | $142,000 | -- | |
| Lizee Lance P | $147,500 | -- |
Source: Public Records
Mortgage History
| Date | Status | Borrower | Loan Amount |
|---|---|---|---|
| Open | Hudson Bonnie B | $148,665 | |
| Previous Owner | Turner Sharon M | $141,600 | |
| Previous Owner | Lizee Lance P | $118,000 |
Source: Public Records
Tax History Compared to Growth
Tax History
| Year | Tax Paid | Tax Assessment Tax Assessment Total Assessment is a certain percentage of the fair market value that is determined by local assessors to be the total taxable value of land and additions on the property. | Land | Improvement |
|---|---|---|---|---|
| 2025 | $979 | $151,320 | $30,000 | $121,320 |
| 2024 | $982 | $151,320 | $30,000 | $121,320 |
| 2023 | $776 | $151,320 | $30,000 | $121,320 |
| 2022 | $891 | $120,692 | $22,000 | $98,692 |
| 2021 | $891 | $120,692 | $22,000 | $98,692 |
| 2020 | $830 | $100,196 | $18,000 | $82,196 |
| 2019 | $826 | $98,936 | $18,000 | $80,936 |
| 2018 | $807 | $92,768 | $18,000 | $74,768 |
| 2017 | $699 | $89,212 | $18,000 | $71,212 |
| 2016 | $665 | $77,640 | $18,000 | $59,640 |
| 2015 | $599 | $63,500 | $16,000 | $47,500 |
| 2014 | $613 | $63,500 | $0 | $0 |
Source: Public Records
Map
Nearby Homes
- 1814 Chasewood Park Dr
- 1829 Chasewood Park Dr
- 1756 Brown Cir
- 1730 MacBy Dr
- 2742 Bob Bettis Rd
- 1748 Brown Cir
- 2729 Stillwater Lake Ln Unit 1
- 1597 Sprayberry Dr
- 2725 Stillwater Lake Ln Unit 2
- 1611 Northwoods Dr
- 1919 Redfield Rd NE Unit Homesite 19
- 2591 Alcovy Trail NE
- 2904 Goldfinch Cir
- 1935 Redfield Rd NE
- 1939 Redfield Rd NE
- 2588 Alcovy Trail NE
- 2839 Pine Meadow Dr
- 2170 Beaver Shop Rd
- 2243 Rosemoore Walk
- 2511 Waterstone Way
- 1820 Chasewood Park Dr
- 1816 Chasewood Park Dr
- 2736 Ashbury Point Ln
- 2734 Ashbury Point Ln
- 1822 Chasewood Park Dr
- 2738 Ashbury Point Ln
- 2732 Ashbury Point Ln
- 1824 Chasewood Park Dr
- 1817 Chasewood Park Dr
- 1812 Chasewood Park Dr
- 1819 Chasewood Park Dr
- 1815 Chasewood Park Dr
- 2730 Ashbury Point Ln
- 1821 Chasewood Park Dr
- 1826 Chasewood Park Dr
- 1823 Chasewood Park Dr
- 1813 Chasewood Park Dr
- 2733 Ashbury Point Ln
- 2728 Ashbury Point Ln
- 2731 Ashbury Point Ln