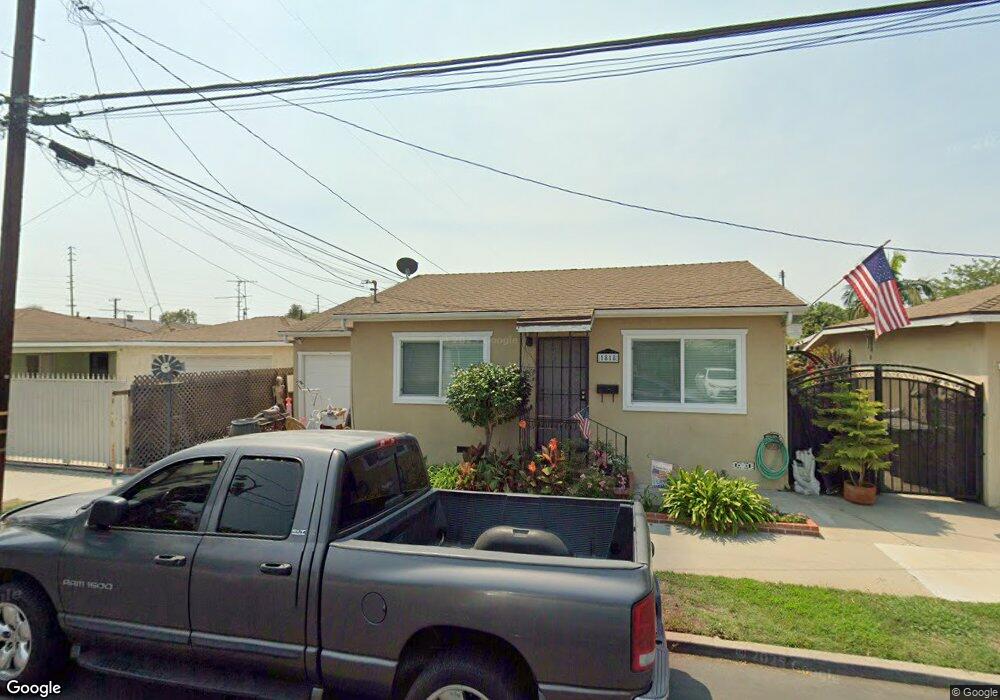
1818 E Hungerford St Long Beach, CA 90805
Nehyam NeighborhoodEstimated Value: $752,989 - $881,000
3
Beds
2
Baths
1,540
Sq Ft
$542/Sq Ft
Est. Value
About This Home
This home is located at 1818 E Hungerford St, Long Beach, CA 90805 and is currently estimated at $833,997, approximately $541 per square foot. 1818 E Hungerford St is a home located in Los Angeles County with nearby schools including Bret Harte Elementary School, Lindbergh STEM Academy, and Jordan High School.
Ownership History
Date
Name
Owned For
Owner Type
Purchase Details
Closed on
Sep 27, 2009
Sold by
Mallory John W and Mallory John
Bought by
Mallory John W and Sasseen Peggy D
Current Estimated Value
Purchase Details
Closed on
Aug 12, 1998
Sold by
Gray Gerald L and Gray Barbara A
Bought by
Mallory John
Home Financials for this Owner
Home Financials are based on the most recent Mortgage that was taken out on this home.
Original Mortgage
$132,925
Interest Rate
6.76%
Mortgage Type
FHA
Create a Home Valuation Report for This Property
The Home Valuation Report is an in-depth analysis detailing your home's value as well as a comparison with similar homes in the area
Home Values in the Area
Average Home Value in this Area
Purchase History
| Date | Buyer | Sale Price | Title Company |
|---|---|---|---|
| Mallory John W | -- | Progressive Title | |
| Mallory John | $150,000 | Fidelity National Title Ins |
Source: Public Records
Mortgage History
| Date | Status | Borrower | Loan Amount |
|---|---|---|---|
| Previous Owner | Mallory John | $132,925 |
Source: Public Records
Tax History Compared to Growth
Tax History
| Year | Tax Paid | Tax Assessment Tax Assessment Total Assessment is a certain percentage of the fair market value that is determined by local assessors to be the total taxable value of land and additions on the property. | Land | Improvement |
|---|---|---|---|---|
| 2025 | $3,338 | $235,131 | $94,049 | $141,082 |
| 2024 | $3,338 | $230,521 | $92,205 | $138,316 |
| 2023 | $3,280 | $226,002 | $90,398 | $135,604 |
| 2022 | $3,090 | $221,572 | $88,626 | $132,946 |
| 2021 | $3,021 | $217,229 | $86,889 | $130,340 |
| 2020 | $3,013 | $215,003 | $85,999 | $129,004 |
| 2019 | $2,978 | $210,788 | $84,313 | $126,475 |
| 2018 | $2,828 | $206,656 | $82,660 | $123,996 |
| 2016 | $2,599 | $198,633 | $79,451 | $119,182 |
| 2015 | $2,500 | $195,650 | $78,258 | $117,392 |
| 2014 | $2,493 | $191,819 | $76,726 | $115,093 |
Source: Public Records
Map
Nearby Homes
- 5943 Gardenia Ave
- 5959 Cherry Ave
- 5846 Gardenia Ave
- 5916 Walnut Ave
- 5845 Gundry Ave
- 5910 Brayton Ave
- 6160 Brayton Ave
- 5390 5390 Orange
- 1222 E 57th St
- 6140 Orange Ave
- 1430 E Michelson St
- 6161 Orange Ave
- 1501 E 63rd St
- 1921 E Washington St
- 5535 Ackerfield Ave Unit 47
- 5535 Ackerfield Ave Unit 9
- 1061 E South St
- 5530 Ackerfield Ave Unit 206
- 5500 Ackerfield Ave Unit 104
- 5500 Ackerfield Ave Unit 208
- 5918 Rose Ave
- 5916 Rose Ave
- 5921 Gardenia Ave
- 5912 Rose Ave
- 5919 Gardenia Ave
- 1811 E Hungerford St
- 5934 Rose Ave
- 1815 E Hungerford St
- 5915 Gardenia Ave
- 1823 E Hungerford St
- 5915 Gardenia Ave Back House
- 5923 Rose Ave
- 5911 Gardenia Ave
- 5919 Rose Ave
- 1829 E Hungerford St
- 5929 Rose Ave
- 5915 Rose Ave
- 1809 E 59th St
- 5910 Rose Ave
- 1817 E 59th St