
Seller's Agent in 2022
Jim McKinnies
McKinnies Realty, LLC
(574) 229-8808
572 Total Sales
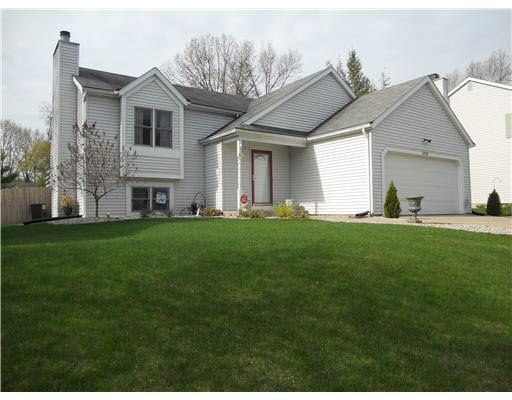
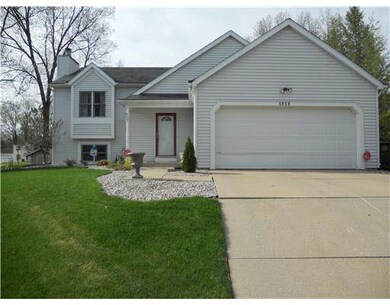
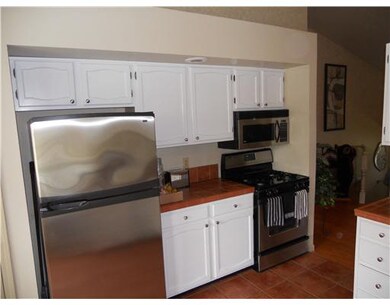
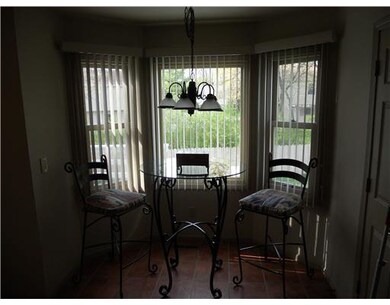
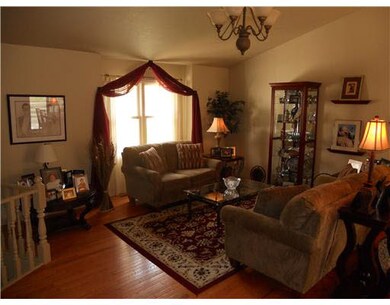
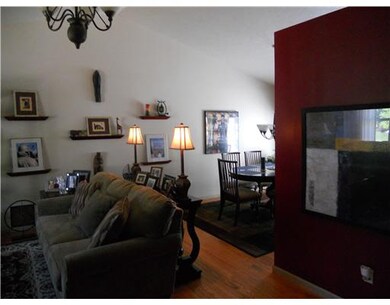
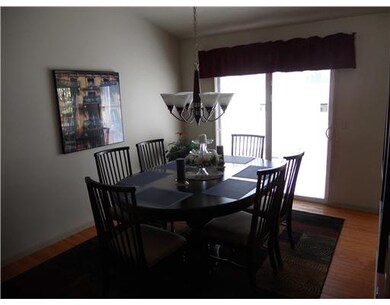
THIS HOME HAS SO MUCH SPACE FOR THE MONEY, OVER 2330 SQ FT.! KITCHEN WITH STAINLESS APPLIANCES, BREAKFAST NOOK, FORMAL DINING ROOM, LARGE LIVING ROOM WITH CATHEDRAL CEILINGS,HARDWOOD FLOORS, TWO BEDROOMS, 1 FULL BATH ON THE MAIN FLOOR. THE LOWER LEVEL HAS A FAMILY ROOM WITH FIREPLACE, TWO MORE BEDROOMS AND A BONUS ROOM CURRENTLY USED AS AN OFFICE OR WOULD MAKE A GREAT GAME ROOM, OR ENTERTAINING AREA. FRESHLY PAINTED WITH SOME NEW CARPETING. FURNACE, WATER HEATER, SOFTENER NEW IN THE LAST FOUR YEARS. SPRINKLING SYSTEM, PRIVATE BACK YARD WITH A 1 YR. OLD CEDAR FENCE. CALL NOW BEFORE IT'S GONE! Less than 1 Acre
| Date | Type | Sale Price | Title Company |
|---|---|---|---|
| Warranty Deed | -- | Metropolitan Title | |
| Warranty Deed | -- | Fidelity National Title | |
| Warranty Deed | -- | -- | |
| Warranty Deed | -- | Metropolitan Title |
| Date | Status | Loan Amount | Loan Type |
|---|---|---|---|
| Open | $256,500 | New Conventional | |
| Previous Owner | $173,000 | No Value Available | |
| Previous Owner | $116,000 | No Value Available |
| Date | Event | Price | Change | Sq Ft Price |
|---|---|---|---|---|
| 11/03/2022 11/03/22 | Sold | $270,000 | +3.8% | $116 / Sq Ft |
| 10/31/2022 10/31/22 | Pending | -- | -- | -- |
| 10/04/2022 10/04/22 | For Sale | $259,999 | 0.0% | $112 / Sq Ft |
| 10/04/2022 10/04/22 | Pending | -- | -- | -- |
| 10/01/2022 10/01/22 | Price Changed | $259,999 | -3.7% | $112 / Sq Ft |
| 09/20/2022 09/20/22 | For Sale | $269,900 | +56.0% | $116 / Sq Ft |
| 05/10/2019 05/10/19 | Sold | $173,000 | -1.1% | $74 / Sq Ft |
| 02/25/2019 02/25/19 | Pending | -- | -- | -- |
| 02/21/2019 02/21/19 | For Sale | $174,900 | +20.6% | $75 / Sq Ft |
| 07/31/2013 07/31/13 | Sold | $145,000 | -3.3% | $62 / Sq Ft |
| 07/01/2013 07/01/13 | Pending | -- | -- | -- |
| 05/03/2013 05/03/13 | For Sale | $149,900 | -- | $64 / Sq Ft |
| Year | Tax Paid | Tax Assessment Tax Assessment Total Assessment is a certain percentage of the fair market value that is determined by local assessors to be the total taxable value of land and additions on the property. | Land | Improvement |
|---|---|---|---|---|
| 2024 | $2,670 | $256,500 | $34,600 | $221,900 |
| 2023 | $2,586 | $222,500 | $34,600 | $187,900 |
| 2022 | $2,586 | $222,500 | $34,600 | $187,900 |
| 2021 | $2,045 | $177,000 | $37,700 | $139,300 |
| 2020 | $2,077 | $171,700 | $36,600 | $135,100 |
| 2019 | $1,706 | $166,300 | $35,400 | $130,900 |
| 2018 | $1,840 | $153,500 | $31,800 | $121,700 |
| 2017 | $1,802 | $145,200 | $31,800 | $113,400 |
| 2016 | $1,835 | $145,200 | $31,800 | $113,400 |
| 2014 | $1,571 | $127,900 | $15,700 | $112,200 |
| 2013 | $1,613 | $130,800 | $15,700 | $115,100 |
Seller's Agent in 2022
Jim McKinnies
McKinnies Realty, LLC
(574) 229-8808
572 Total Sales
Buyer's Agent in 2022
Caleb Worm
Weichert Rltrs-J.Dunfee&Assoc.
(574) 240-9676
81 Total Sales
Seller's Agent in 2019
Joseph Tiffany
Tiffany Group Real Estate Advisors LLC
(574) 252-4111
29 Total Sales
Buyer's Agent in 2019
Rob Bach
Hallmark Excellence Realty
(574) 202-9986
10 Total Sales
Seller's Agent in 2013
Greg Gray
Polack Realty
(574) 210-7224
147 Total Sales
A
Buyer's Agent in 2013
Amy Ziolkowski
Ziolkowski Realty LLC
27 Total Sales
Source: Indiana Regional MLS
MLS Number: 588664
APN: 71-03-22-280-009.000-009
Disclaimer: Certain information contained herein is derived from information provided by parties other than Homes.com. All information provided is deemed reliable, but is not guaranteed to be accurate and should be independently verified.
![]() IDX information is provided exclusively for personal, non-commercial use, and may not be used for any purpose other than to identify prospective properties consumers may be interested in purchasing. Information is deemed reliable but not guaranteed.
IDX information is provided exclusively for personal, non-commercial use, and may not be used for any purpose other than to identify prospective properties consumers may be interested in purchasing. Information is deemed reliable but not guaranteed.