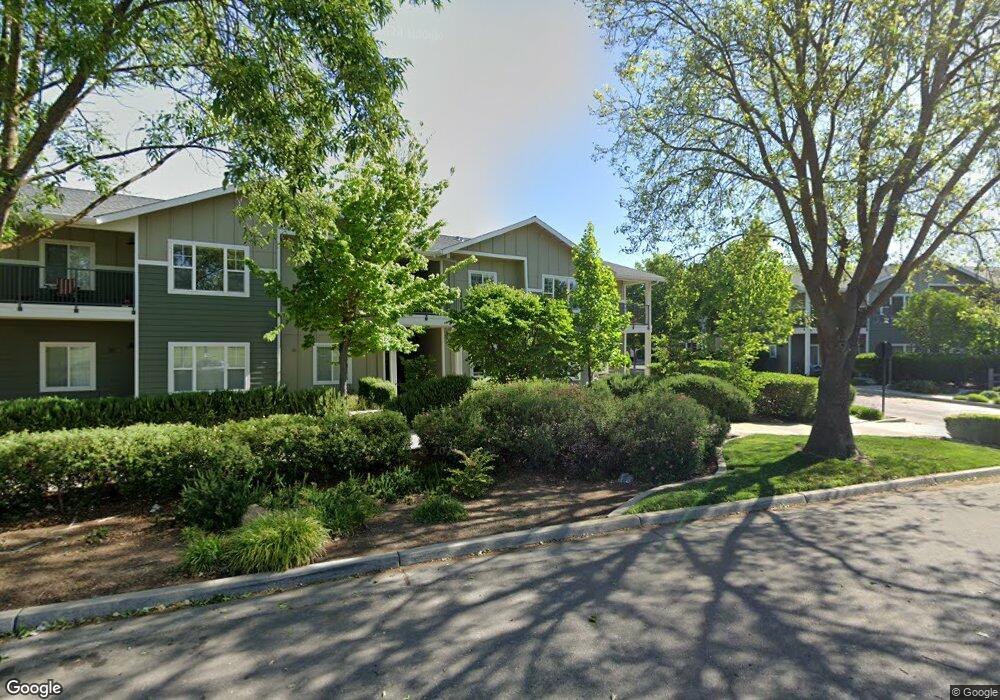
1818 Moore Blvd Unit 219 Davis, CA 95618
North Davis NeighborhoodEstimated Value: $483,000 - $547,000
4
Beds
3
Baths
1,411
Sq Ft
$373/Sq Ft
Est. Value
About This Home
This home is located at 1818 Moore Blvd Unit 219, Davis, CA 95618 and is currently estimated at $526,784, approximately $373 per square foot. 1818 Moore Blvd Unit 219 is a home located in Yolo County with nearby schools including Birch Lane Elementary School, Oliver Wendell Holmes Junior High School, and Davis Senior High School.
Ownership History
Date
Name
Owned For
Owner Type
Purchase Details
Closed on
Jan 18, 2024
Sold by
Abusaa Taysir
Bought by
Abusaa Irrevocable Grantor Trust and Abusaa
Current Estimated Value
Purchase Details
Closed on
Jul 23, 2015
Sold by
Sayeeduddin Ismall A
Bought by
Abusaa Taysir and Abusaa Ryan
Home Financials for this Owner
Home Financials are based on the most recent Mortgage that was taken out on this home.
Original Mortgage
$328,500
Interest Rate
3.98%
Mortgage Type
New Conventional
Purchase Details
Closed on
Feb 6, 2007
Sold by
Cp Wildhorse Condominiums Llc
Bought by
Sayeeduddin Ismail A
Home Financials for this Owner
Home Financials are based on the most recent Mortgage that was taken out on this home.
Original Mortgage
$389,990
Interest Rate
6.17%
Mortgage Type
Purchase Money Mortgage
Create a Home Valuation Report for This Property
The Home Valuation Report is an in-depth analysis detailing your home's value as well as a comparison with similar homes in the area
Home Values in the Area
Average Home Value in this Area
Purchase History
| Date | Buyer | Sale Price | Title Company |
|---|---|---|---|
| Abusaa Irrevocable Grantor Trust | -- | None Listed On Document | |
| Abusaa Taysir | $365,000 | Placer Title Company | |
| Sayeeduddin Ismail A | $390,000 | First American Title Co |
Source: Public Records
Mortgage History
| Date | Status | Borrower | Loan Amount |
|---|---|---|---|
| Previous Owner | Abusaa Taysir | $328,500 | |
| Previous Owner | Sayeeduddin Ismail A | $389,990 |
Source: Public Records
Tax History
| Year | Tax Paid | Tax Assessment Tax Assessment Total Assessment is a certain percentage of the fair market value that is determined by local assessors to be the total taxable value of land and additions on the property. | Land | Improvement |
|---|---|---|---|---|
| 2025 | $6,895 | $516,939 | $182,260 | $334,679 |
| 2023 | $6,895 | $415,303 | $147,916 | $267,387 |
| 2022 | $6,635 | $407,161 | $145,016 | $262,145 |
| 2021 | $6,494 | $399,178 | $142,173 | $257,005 |
| 2020 | $6,383 | $395,086 | $140,716 | $254,370 |
| 2019 | $6,090 | $387,340 | $137,957 | $249,383 |
| 2018 | $5,742 | $379,746 | $135,252 | $244,494 |
| 2017 | $5,651 | $372,300 | $132,600 | $239,700 |
| 2016 | $5,514 | $365,000 | $130,000 | $235,000 |
| 2015 | -- | $315,000 | $130,000 | $185,000 |
| 2014 | -- | $280,000 | $110,000 | $170,000 |
Source: Public Records
Map
Nearby Homes
- 1818 Moore Blvd Unit 201
- 2015 Bishop Place
- 1712 Fremont Ct Unit 4
- 1730 Fremont Ct Unit 2
- 1703 Donner Ave Unit 1
- 2033 Manet Place
- 2024 Manet Place
- 2385 Roualt St
- 2343 Caravaggio Dr
- 2603 Bellows St
- 1821 Cannery Loop
- 1769 Cannery Loop
- 1501 Madrone Ln
- 1037 Forbes Ln
- 1411 Madrone Ln
- 1952 Cannery Loop
- 1053 Caspian Pink Terrace
- 1673 Vine St
- 1000 Berryessa Ln Unit 333
- 1000 Berryessa Ln Unit 232
- 1818 Moore Blvd
- 1818 Moore Blvd Unit 222
- 1818 Moore Blvd Unit 221
- 1818 Moore Blvd Unit 220
- 1818 Moore Blvd Unit 218
- 1818 Moore Blvd Unit 217
- 1818 Moore Blvd Unit 216
- 1818 Moore Blvd Unit 215
- 1818 Moore Blvd Unit 214
- 1818 Moore Blvd Unit 213
- 1818 Moore Blvd Unit 122
- 1818 Moore Blvd Unit 118
- 1818 Moore Blvd Unit 113
- 1818 Moore Blvd Unit 233
- 1818 Moore Blvd Unit 232
- 1818 Moore Blvd Unit 231
- 1818 Moore Blvd Unit 230
- 1818 Moore Blvd Unit 229
- 1818 Moore Blvd Unit 228
- 1818 Moore Blvd Unit 227
Your Personal Tour Guide
Ask me questions while you tour the home.