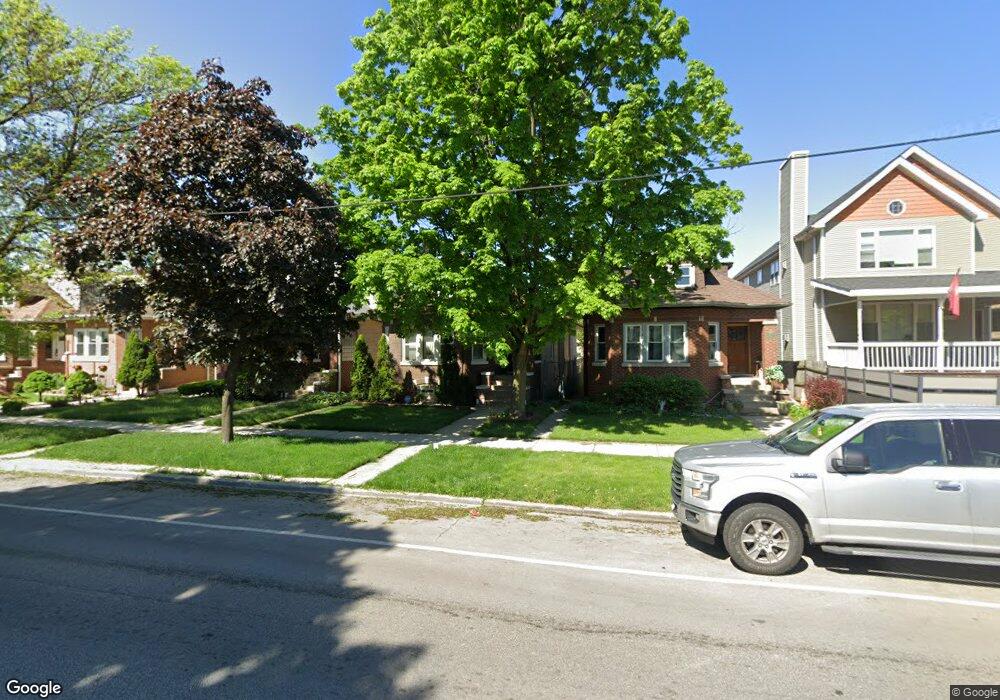
1818 N Narragansett Ave Chicago, IL 60639
Galewood NeighborhoodEstimated Value: $304,000 - $411,000
2
Beds
1
Bath
1,098
Sq Ft
$317/Sq Ft
Est. Value
About This Home
This home is located at 1818 N Narragansett Ave, Chicago, IL 60639 and is currently estimated at $348,209, approximately $317 per square foot. 1818 N Narragansett Ave is a home located in Cook County with nearby schools including Lovett Elementary School, Steinmetz College Prep, and Acero - Roberto Clemente Elementary School.
Ownership History
Date
Name
Owned For
Owner Type
Purchase Details
Closed on
Oct 29, 2001
Sold by
Dunn Nancy I
Bought by
Dunn Virginia P and Trust #1
Current Estimated Value
Purchase Details
Closed on
Oct 23, 2001
Sold by
Dunn Maureen P
Bought by
Dunn Virginia P and Trust #1
Purchase Details
Closed on
Sep 18, 2001
Sold by
Dunn Virginia P and Dunn Robert A
Bought by
Dunn Virginia P and Trust #1
Purchase Details
Closed on
Sep 22, 1999
Sold by
Sanders Jimmy L
Bought by
Gladney Cindy
Home Financials for this Owner
Home Financials are based on the most recent Mortgage that was taken out on this home.
Original Mortgage
$155,956
Outstanding Balance
$46,779
Interest Rate
8.21%
Mortgage Type
FHA
Estimated Equity
$301,430
Purchase Details
Closed on
Feb 10, 1994
Sold by
Bublitz William and Biggs Lois
Bought by
Sanders Jimmy L
Home Financials for this Owner
Home Financials are based on the most recent Mortgage that was taken out on this home.
Original Mortgage
$109,300
Interest Rate
7.1%
Mortgage Type
FHA
Create a Home Valuation Report for This Property
The Home Valuation Report is an in-depth analysis detailing your home's value as well as a comparison with similar homes in the area
Home Values in the Area
Average Home Value in this Area
Purchase History
| Date | Buyer | Sale Price | Title Company |
|---|---|---|---|
| Dunn Virginia P | -- | -- | |
| Dunn Virginia P | -- | -- | |
| Dunn Virginia P | -- | -- | |
| Dunn Virginia P | -- | -- | |
| Dunn Virginia P | -- | -- | |
| Dunn Virginia P | -- | -- | |
| Gladney Cindy | $157,000 | -- | |
| Sanders Jimmy L | $73,000 | -- |
Source: Public Records
Mortgage History
| Date | Status | Borrower | Loan Amount |
|---|---|---|---|
| Open | Gladney Cindy | $155,956 | |
| Previous Owner | Sanders Jimmy L | $109,300 |
Source: Public Records
Tax History Compared to Growth
Tax History
| Year | Tax Paid | Tax Assessment Tax Assessment Total Assessment is a certain percentage of the fair market value that is determined by local assessors to be the total taxable value of land and additions on the property. | Land | Improvement |
|---|---|---|---|---|
| 2024 | $3,733 | $26,000 | $14,499 | $11,501 |
| 2023 | $3,618 | $21,000 | $10,709 | $10,291 |
| 2022 | $3,618 | $21,000 | $10,709 | $10,291 |
| 2021 | $3,555 | $20,999 | $10,709 | $10,290 |
| 2020 | $3,692 | $19,666 | $6,757 | $12,909 |
| 2019 | $3,753 | $22,097 | $6,757 | $15,340 |
| 2018 | $3,688 | $22,097 | $6,757 | $15,340 |
| 2017 | $4,031 | $22,091 | $5,946 | $16,145 |
| 2016 | $3,927 | $22,091 | $5,946 | $16,145 |
| 2015 | $3,569 | $22,091 | $5,946 | $16,145 |
| 2014 | $3,445 | $21,122 | $5,406 | $15,716 |
| 2013 | $3,366 | $21,122 | $5,406 | $15,716 |
Source: Public Records
Map
Nearby Homes
- 1627 N Narragansett Ave
- 1700 N Natoma Ave
- 1221 Edmer Ave
- 1639 N Normandy Ave
- 1937 N Normandy Ave
- 1227 N East Ave
- 1212 N Harvey Ave
- 1733 N Oak Park Ave
- 1122 N Ridgeland Ave
- 1221 Hayes Ave
- 1715 N Meade Ave
- 1104 Fair Oaks Ave
- 1618 N Mcvicker Ave
- 102 Le Moyne Pkwy
- 1625 N Mcvicker Ave
- 34 Le Moyne Pkwy
- 1115 N Taylor Ave
- 1657 N Austin Ave
- 1701 N Newland Ave
- 1600 N New England Ave Unit 4
- 1816 N Narragansett Ave
- 1822 N Narragansett Ave
- 1826 N Narragansett Ave
- 1814 N Narragansett Ave
- 1828 N Narragansett Ave
- 1810 N Narragansett Ave
- 1830 N Narragansett Ave
- 1806 N Narragansett Ave
- 1832 N Narragansett Ave
- 6410 W Bloomingdale Ave
- 1836 N Narragansett Ave
- 6402 W Bloomingdale Ave
- 6400 W Bloomingdale Ave
- 6414 W Bloomingdale Ave
- 1819 N Nagle Ave
- 1817 N Nagle Ave
- 1825 N Nagle Ave
- 1815 N Nagle Ave
- 1827 N Nagle Ave