1818 SW 43rd St Pendleton, OR 97801
Estimated Value: $325,454 - $370,000
3
Beds
1
Bath
1,320
Sq Ft
$264/Sq Ft
Est. Value
About This Home
This home is located at 1818 SW 43rd St, Pendleton, OR 97801 and is currently estimated at $347,864, approximately $263 per square foot. 1818 SW 43rd St is a home located in Umatilla County with nearby schools including McKay Creek Elementary School, Sunridge Middle School, and Pendleton High School.
Ownership History
Date
Name
Owned For
Owner Type
Purchase Details
Closed on
Nov 22, 2011
Sold by
Neistadt Byron R and Neistadt Makenzie M
Bought by
Leonard John R
Current Estimated Value
Home Financials for this Owner
Home Financials are based on the most recent Mortgage that was taken out on this home.
Original Mortgage
$148,500
Outstanding Balance
$100,526
Interest Rate
3.87%
Mortgage Type
New Conventional
Estimated Equity
$247,338
Purchase Details
Closed on
Feb 8, 2010
Sold by
Nice Kevin M
Bought by
Nice Makenzie M and Neistadt Byron R
Home Financials for this Owner
Home Financials are based on the most recent Mortgage that was taken out on this home.
Original Mortgage
$155,678
Interest Rate
5.03%
Mortgage Type
FHA
Purchase Details
Closed on
Jun 30, 2005
Sold by
Sater Chet C and Sater Lisa M
Bought by
Nice Kevin M
Home Financials for this Owner
Home Financials are based on the most recent Mortgage that was taken out on this home.
Original Mortgage
$142,759
Interest Rate
5.65%
Mortgage Type
FHA
Create a Home Valuation Report for This Property
The Home Valuation Report is an in-depth analysis detailing your home's value as well as a comparison with similar homes in the area
Home Values in the Area
Average Home Value in this Area
Purchase History
| Date | Buyer | Sale Price | Title Company |
|---|---|---|---|
| Leonard John R | $165,000 | Pioneer Title Co | |
| Nice Makenzie M | $170,000 | Amerititle | |
| Nice Kevin M | $145,000 | Amerititle |
Source: Public Records
Mortgage History
| Date | Status | Borrower | Loan Amount |
|---|---|---|---|
| Open | Leonard John R | $148,500 | |
| Previous Owner | Nice Makenzie M | $155,678 | |
| Previous Owner | Nice Kevin M | $142,759 |
Source: Public Records
Tax History
| Year | Tax Paid | Tax Assessment Tax Assessment Total Assessment is a certain percentage of the fair market value that is determined by local assessors to be the total taxable value of land and additions on the property. | Land | Improvement |
|---|---|---|---|---|
| 2022 | $2,901 | $158,620 | $0 | $0 |
| 2021 | $2,918 | $154,000 | $38,360 | $115,640 |
| 2020 | $2,818 | $149,520 | $37,240 | $112,280 |
| 2018 | $2,714 | $140,950 | $35,100 | $105,850 |
| 2017 | $2,661 | $136,850 | $34,080 | $102,770 |
| 2016 | $2,474 | $132,870 | $33,090 | $99,780 |
| 2015 | $2,483 | $121,610 | $30,280 | $91,330 |
| 2014 | $2,338 | $121,610 | $30,280 | $91,330 |
Source: Public Records
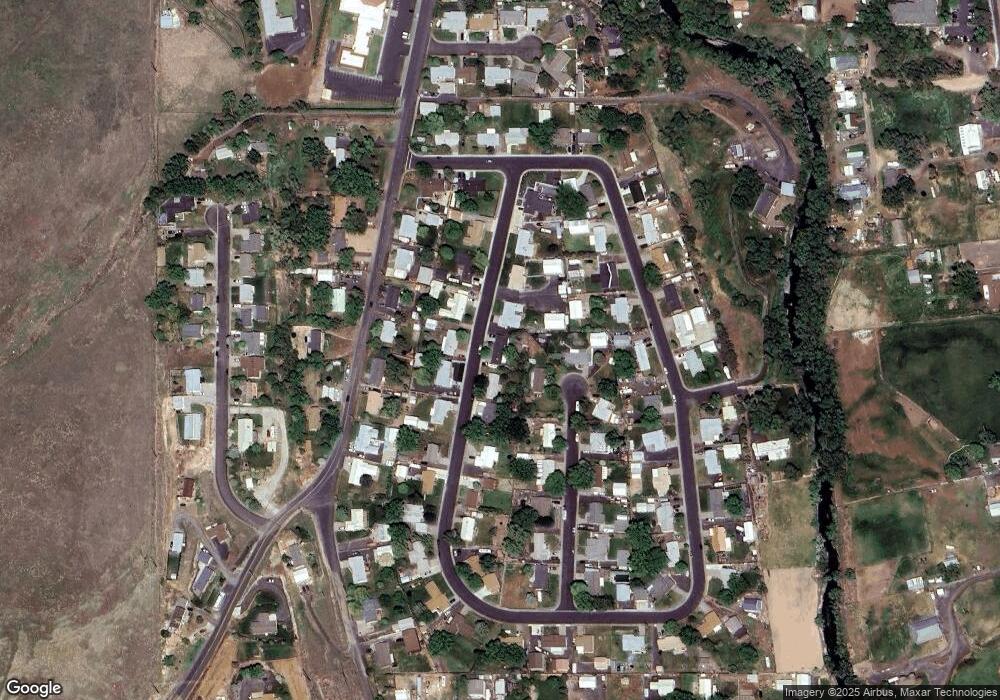
Map
Nearby Homes
- 904 SW 43rd St
- 1536 SW 44th St
- 0 Mckay Dr
- 1437 SW 37th St Unit 43
- 72062 Westfield Blvd
- 4226 SW Kirk Ave
- 0 SW Kirk Ave Unit 200 21392184
- 0 SW Kirk Ave Unit 101 21527345
- 0 SW Kirk Ave Unit 5500 21002117
- 1004 SW 33rd St
- 3307 SW Kirk Ave
- 814 SW 44th St
- 3218 SW Isaac Ave
- 1901 SW Runnion Ln
- 0 SW Quinney Ln Unit 24414661
- 1414 SW 24th St
- 0 SW Ladow Ave Unit Lot 41
- 0 SW Ladow Ave Unit Lot 42
- 0 SW Ladow Ave Unit Lot 43
- 3014 SW Kirk Ave
- 1822 SW 43rd St
- 1903 SW Vista Place
- 1814 SW 43rd St
- 1826 SW 43rd St
- 1902 SW Vista Place
- 1819 SW 43rd St
- 1823 SW 43rd St
- 1817 SW 43rd St
- 1810 SW 43rd St
- 1907 SW Vista Place
- 1903 SW 43rd St
- 1813 SW 43rd St
- 1906 SW Vista Place
- 1815 SW 42nd St
- 1906 SW 43rd St
- 1818 SW 44th St
- 1806 SW 43rd St
- 1814 SW 44th St
- 1811 SW 42nd St
- 1822 SW 44th St
Your Personal Tour Guide
Ask me questions while you tour the home.