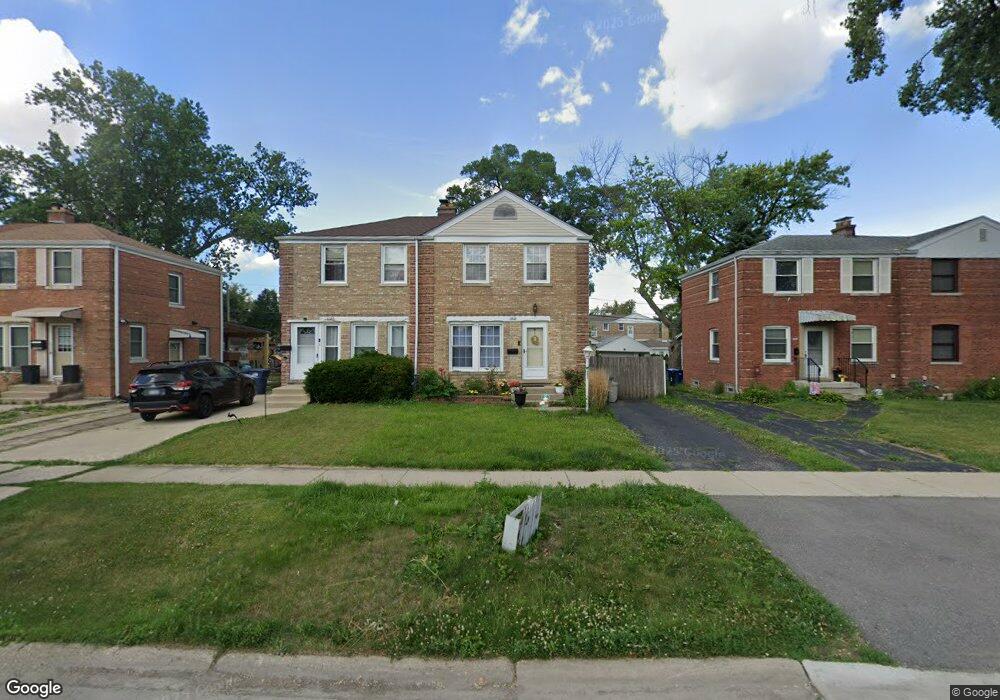
1818 Sycamore St Des Plaines, IL 60018
Estimated Value: $266,000 - $312,000
2
Beds
1
Bath
895
Sq Ft
$318/Sq Ft
Est. Value
About This Home
This home is located at 1818 Sycamore St, Des Plaines, IL 60018 and is currently estimated at $285,030, approximately $318 per square foot. 1818 Sycamore St is a home located in Cook County with nearby schools including South Elementary School, Algonquin Middle School, and Maine West High School.
Ownership History
Date
Name
Owned For
Owner Type
Purchase Details
Closed on
Mar 3, 2005
Sold by
Gornikowski Joanna
Bought by
Gornikowski Wiktor and Gornikowski Joanna
Current Estimated Value
Purchase Details
Closed on
Dec 21, 2001
Sold by
Payne Tracy D
Bought by
Gornikowski Joanna
Home Financials for this Owner
Home Financials are based on the most recent Mortgage that was taken out on this home.
Original Mortgage
$147,250
Outstanding Balance
$59,670
Interest Rate
7.07%
Mortgage Type
Purchase Money Mortgage
Estimated Equity
$225,360
Purchase Details
Closed on
Mar 17, 1994
Sold by
Herr Ronald J and Herr Carin J
Bought by
Payne Tracy D
Home Financials for this Owner
Home Financials are based on the most recent Mortgage that was taken out on this home.
Original Mortgage
$114,000
Interest Rate
7.27%
Create a Home Valuation Report for This Property
The Home Valuation Report is an in-depth analysis detailing your home's value as well as a comparison with similar homes in the area
Home Values in the Area
Average Home Value in this Area
Purchase History
| Date | Buyer | Sale Price | Title Company |
|---|---|---|---|
| Gornikowski Wiktor | -- | -- | |
| Gornikowski Joanna | $155,000 | Chicago Title Insurance Co | |
| Payne Tracy D | $80,000 | -- |
Source: Public Records
Mortgage History
| Date | Status | Borrower | Loan Amount |
|---|---|---|---|
| Open | Gornikowski Joanna | $147,250 | |
| Previous Owner | Payne Tracy D | $114,000 |
Source: Public Records
Tax History Compared to Growth
Tax History
| Year | Tax Paid | Tax Assessment Tax Assessment Total Assessment is a certain percentage of the fair market value that is determined by local assessors to be the total taxable value of land and additions on the property. | Land | Improvement |
|---|---|---|---|---|
| 2024 | $4,398 | $20,000 | $3,500 | $16,500 |
| 2023 | $4,266 | $20,000 | $3,500 | $16,500 |
| 2022 | $4,266 | $20,000 | $3,500 | $16,500 |
| 2021 | $3,222 | $13,812 | $2,410 | $11,402 |
| 2020 | $3,236 | $13,812 | $2,410 | $11,402 |
| 2019 | $3,557 | $16,645 | $2,410 | $14,235 |
| 2018 | $2,249 | $10,955 | $2,121 | $8,834 |
| 2017 | $3,590 | $15,596 | $2,121 | $13,475 |
| 2016 | $3,640 | $15,596 | $2,121 | $13,475 |
| 2015 | $2,927 | $12,304 | $1,832 | $10,472 |
| 2014 | $2,881 | $12,304 | $1,832 | $10,472 |
| 2013 | $3,155 | $13,562 | $1,832 | $11,730 |
Source: Public Records
Map
Nearby Homes
- 1721 Linden St
- 1928 Kennicott Ct
- 1724 Illinois St
- 1640 S River Rd
- 1689 S Elm St
- 1536 Orchard St
- 1632 S Elm St
- 2017 Pine St Unit B
- 1700 E Forest Ave
- 1783 Lee St
- 1706 Buckingham Dr
- 1641 E Touhy Ave
- 1629 E Touhy Ave
- 1278 E River Dr
- 2500 Maple St
- 1489 E Algonquin Rd
- 38 E Touhy Ave
- 1966 Laura Ln
- 2609 Eisenhower Dr
- 2646 Maple St
- 1820 Sycamore St
- 1820 Sycamore St Unit 2
- 1814 Sycamore St
- 1828 Sycamore St
- 1812 Sycamore St
- 1830 Sycamore St
- 1836 Sycamore St
- 1819 Sycamore St
- 1817 Orchard St
- 1807 Sycamore St
- 1819 Orchard St
- 1827 Orchard St
- 1846 Sycamore St
- 1740 Everett Ave
- 1811 Orchard St
- 1827 Sycamore St
- 1813 Orchard St
- 1829 Orchard St
- 1835 Orchard St
- 1835 Sycamore St