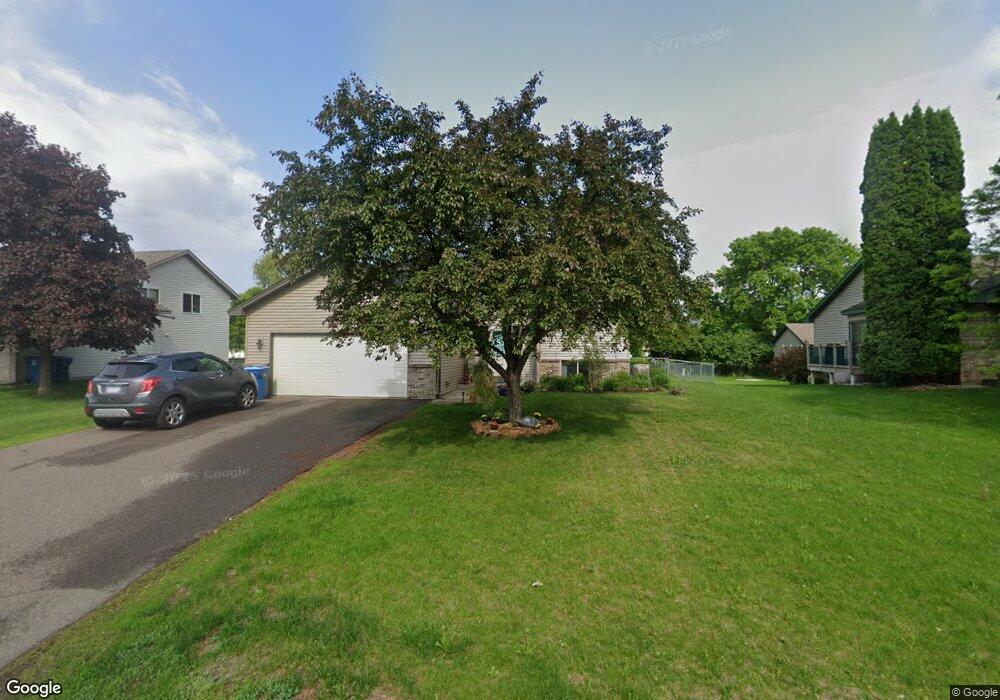
18181 Ironton St NW Elk River, MN 55330
Estimated Value: $323,000 - $347,000
4
Beds
2
Baths
1,100
Sq Ft
$306/Sq Ft
Est. Value
About This Home
This home is located at 18181 Ironton St NW, Elk River, MN 55330 and is currently estimated at $336,465, approximately $305 per square foot. 18181 Ironton St NW is a home located in Sherburne County with nearby schools including Lincoln Elementary School, Vandenberge Middle School, and Elk River Senior High School.
Ownership History
Date
Name
Owned For
Owner Type
Purchase Details
Closed on
Sep 30, 2016
Sold by
Unger Darlene
Bought by
Sance Angela L and Sance Gonzalez Ottoniel
Current Estimated Value
Home Financials for this Owner
Home Financials are based on the most recent Mortgage that was taken out on this home.
Original Mortgage
$187,540
Outstanding Balance
$150,539
Interest Rate
3.5%
Mortgage Type
FHA
Estimated Equity
$185,926
Purchase Details
Closed on
Apr 22, 2011
Sold by
Goeb John Claude and Goeb Mary Jane
Bought by
Unger Darlene
Home Financials for this Owner
Home Financials are based on the most recent Mortgage that was taken out on this home.
Original Mortgage
$151,947
Interest Rate
4.87%
Mortgage Type
FHA
Purchase Details
Closed on
Jul 13, 2001
Sold by
Mollner David and Mollner Sandra J
Bought by
Rasmussen Craig L and Rasmussen Cheryl L
Create a Home Valuation Report for This Property
The Home Valuation Report is an in-depth analysis detailing your home's value as well as a comparison with similar homes in the area
Home Values in the Area
Average Home Value in this Area
Purchase History
| Date | Buyer | Sale Price | Title Company |
|---|---|---|---|
| Sance Angela L | $191,000 | Custom Title Services Llc | |
| Unger Darlene | $155,900 | Land Title Inc | |
| Rasmussen Craig L | $171,800 | -- |
Source: Public Records
Mortgage History
| Date | Status | Borrower | Loan Amount |
|---|---|---|---|
| Open | Sance Angela L | $187,540 | |
| Previous Owner | Unger Darlene | $151,947 |
Source: Public Records
Tax History Compared to Growth
Tax History
| Year | Tax Paid | Tax Assessment Tax Assessment Total Assessment is a certain percentage of the fair market value that is determined by local assessors to be the total taxable value of land and additions on the property. | Land | Improvement |
|---|---|---|---|---|
| 2025 | $3,846 | $307,500 | $89,100 | $218,400 |
| 2024 | $3,806 | $307,000 | $89,100 | $217,900 |
| 2023 | $4,052 | $306,300 | $89,100 | $217,200 |
| 2022 | $3,624 | $305,700 | $101,700 | $204,000 |
| 2020 | $3,412 | $241,900 | $63,800 | $178,100 |
| 2019 | $2,912 | $223,500 | $56,400 | $167,100 |
| 2018 | $2,686 | $208,800 | $53,200 | $155,600 |
| 2017 | $2,528 | $187,900 | $49,900 | $138,000 |
| 2016 | $2,414 | $176,700 | $45,900 | $130,800 |
| 2015 | $2,314 | $145,800 | $36,100 | $109,700 |
| 2014 | $1,862 | $135,400 | $33,500 | $101,900 |
| 2013 | -- | $103,900 | $27,400 | $76,500 |
Source: Public Records
Map
Nearby Homes
- 15603 County Road 30
- 13316 179 1 2 Ave NW
- 18055 Macon St NW
- 18001 Macon St NW
- 13590 182nd Ln NW
- 13222 179 1 2 Ave NW
- 13104 180th Ln NW
- 13062 180th Ave NW
- 13504 Riverview Dr NW
- 18647 Lander St NW
- 18627 Ogden St NW
- 18639 Ogden St NW
- 18539 Queen St NW
- 18663 Ogden Cir NW
- 18651 Ogden Cir NW
- 212 Xenia St
- 13008 96th St NE
- 20469 Salem St
- 18922 Joplin St NW
- 13500 190th Ave NW
- 18181 Ironton St NW
- 18199 Ironton St NW
- 18169 Ironton St NW
- TBD Ironton St NW
- 18186 Hudson St NW
- 18198 Hudson St NW
- 18174 Hudson St NW
- 18207 Ironton St NW
- 18159 Ironton St NW
- 18176 Ironton St NW
- 18202 Ironton St NW
- 18212 Hudson St NW
- 18162 Ironton St NW
- 18143 Ironton St NW
- 18214 Ironton St NW
- 18148 Hudson St NW
- 18150 Ironton St NW
- 18218 Ironton St NW
- 18185 Hudson St NW
- 18197 Hudson St NW