18189 W Nielsen Ave Kerman, CA 93630
Estimated Value: $656,000
1
Bed
1
Bath
435,600
Sq Ft
$2/Sq Ft
Est. Value
About This Home
This home is located at 18189 W Nielsen Ave, Kerman, CA 93630 and is currently estimated at $656,000, approximately $1 per square foot. 18189 W Nielsen Ave is a home located in Fresno County with nearby schools including Sun Empire Elementary School.
Ownership History
Date
Name
Owned For
Owner Type
Purchase Details
Closed on
Apr 4, 2019
Sold by
Samarin Jared Kenneth
Bought by
Samarin Jared Kenneth
Current Estimated Value
Home Financials for this Owner
Home Financials are based on the most recent Mortgage that was taken out on this home.
Original Mortgage
$600,000
Outstanding Balance
$527,507
Interest Rate
4.3%
Mortgage Type
Unknown
Estimated Equity
$128,493
Purchase Details
Closed on
Oct 26, 2011
Sold by
Garza Montalvo Maria Elena
Bought by
Samarin Jared Kenneth
Purchase Details
Closed on
Aug 2, 2005
Sold by
Montalvo Rolando
Bought by
Garza Montalvo Maria Elena
Purchase Details
Closed on
Jul 19, 2005
Sold by
Garza Montalvo Maria Elena and Garza Guadalupe
Bought by
Garza Montalvo Maria Elena
Purchase Details
Closed on
Jan 25, 1995
Sold by
Garza Montalvo Maria Elena
Bought by
Garza Montalvo Maria Elena and Garza Guadalupe
Purchase Details
Closed on
Jan 5, 1995
Sold by
Garza Arturo
Bought by
Garza Montalvo Maria Elena
Create a Home Valuation Report for This Property
The Home Valuation Report is an in-depth analysis detailing your home's value as well as a comparison with similar homes in the area
Home Values in the Area
Average Home Value in this Area
Purchase History
| Date | Buyer | Sale Price | Title Company |
|---|---|---|---|
| Samarin Jared Kenneth | -- | First American Title Company | |
| Samarin Jared Kenneth | $100,000 | Chicago Title Company | |
| Garza Montalvo Maria Elena | -- | -- | |
| Wedgeworth Berta | -- | -- | |
| Garza Guadalupe | -- | -- | |
| Garza Montalvo Maria Elena | -- | -- | |
| Garza Montalvo Maria Elena | -- | -- | |
| Garza Montalvo Maria Elena | -- | -- |
Source: Public Records
Mortgage History
| Date | Status | Borrower | Loan Amount |
|---|---|---|---|
| Open | Samarin Jared Kenneth | $600,000 |
Source: Public Records
Tax History Compared to Growth
Tax History
| Year | Tax Paid | Tax Assessment Tax Assessment Total Assessment is a certain percentage of the fair market value that is determined by local assessors to be the total taxable value of land and additions on the property. | Land | Improvement |
|---|---|---|---|---|
| 2025 | $1,709 | $131,877 | $119,318 | $12,559 |
| 2023 | $1,701 | $126,758 | $114,686 | $12,072 |
| 2022 | $1,689 | $124,274 | $112,438 | $11,836 |
| 2021 | $2,108 | $162,151 | $110,234 | $51,917 |
| 2020 | $2,087 | $160,489 | $109,104 | $51,385 |
| 2019 | $1,882 | $140,742 | $106,965 | $33,777 |
| 2018 | $1,810 | $137,983 | $104,868 | $33,115 |
| 2017 | $1,605 | $135,278 | $102,812 | $32,466 |
| 2016 | $1,458 | $132,627 | $100,797 | $31,830 |
| 2015 | $1,445 | $130,635 | $99,283 | $31,352 |
| 2014 | $1,414 | $128,077 | $97,339 | $30,738 |
Source: Public Records
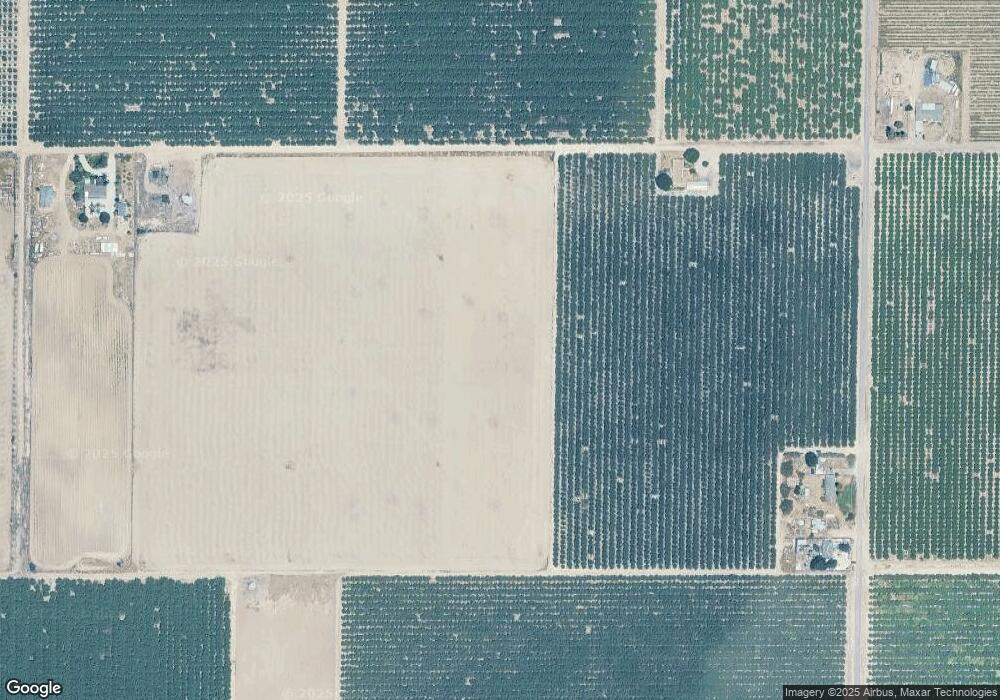
Map
Nearby Homes
- 251 N Trinity Ave
- 16477 W Kearney Blvd
- 16101 W San Joaquin Ave
- 16052 W Middleton Ave
- 450 S Susan Ave
- 16171 W Monterey Ave
- 16151 W Monterey Ave
- 15906 W C St
- 16180 W David Ave
- 16172 W David Ave
- 505 S Del Norte Ave
- 15463 W B St
- 15245 W El Mar Ln
- 220 S Madera Ave Unit SPC 9
- 1 S Plumas Ave
- 575 S 8th St
- 687 S 8th St
- 14621 W C St
- 14288 W El Mar Ave
- 0 North
- 17930 W Nielsen Ave
- 18465 W Nielsen Ave
- 18479 W Nielsen Ave
- 275 N Trinity Ave
- 730 N Trinity Ave
- 22 N Trinity Ave
- 0 N Trinity Ave
- 17723 W Whitesbridge Ave
- 17667 W Belmont Ave
- 749 N Shasta Ave
- 17617 W Belmont Ave
- 17628 W Whitesbridge Ave
- 17500 W Whitesbridge Ave
- 17627 W Whitesbridge Ave
- 622 N Shasta Ave
- 1274 N Humboldt Ave
- 17343 W Nielsen Ave
- 83 S Shasta Ave
- 17402 W Whitesbridge Ave
- 17415 W Whitesbridge Ave