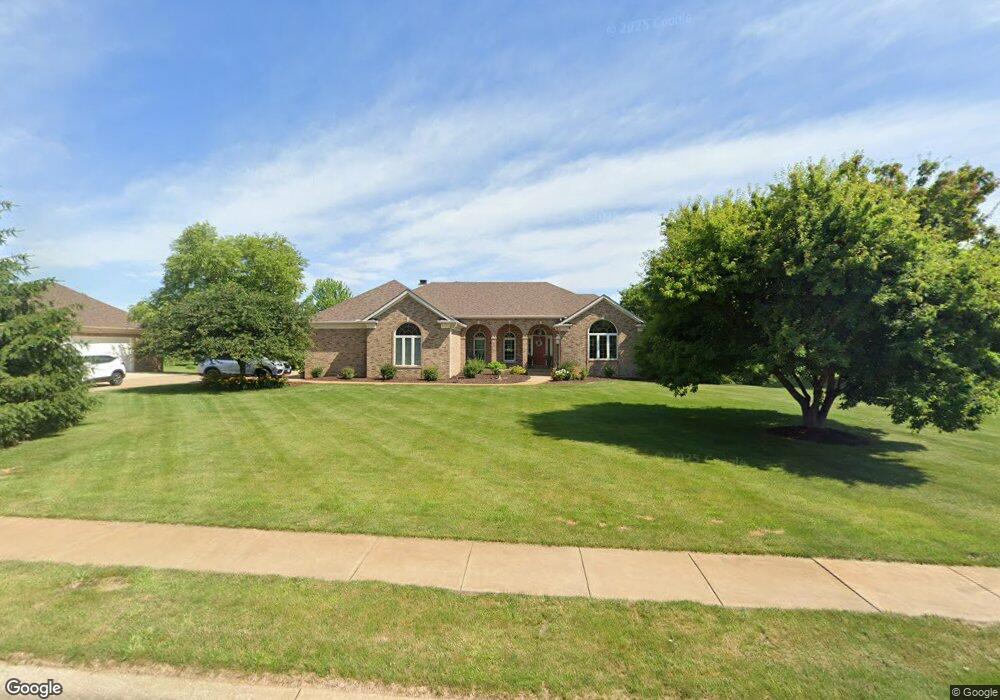
1819 Cromwell Cir Davenport, IA 52807
North Side NeighborhoodEstimated Value: $739,000 - $813,603
5
Beds
4
Baths
3,107
Sq Ft
$251/Sq Ft
Est. Value
About This Home
This home is located at 1819 Cromwell Cir, Davenport, IA 52807 and is currently estimated at $779,401, approximately $250 per square foot. 1819 Cromwell Cir is a home located in Scott County with nearby schools including Eisenhower Elementary School, Sudlow Intermediate School, and Central High School.
Ownership History
Date
Name
Owned For
Owner Type
Purchase Details
Closed on
May 13, 2025
Sold by
Miller Kandice Slater and Slater Kandice J
Bought by
Kandice J Slater Living Trust and Slater
Current Estimated Value
Purchase Details
Closed on
Sep 17, 2024
Sold by
Kandice Slater Miller Home Living Trust and Miller Kandice Slater
Bought by
Miller Kandice Slater
Purchase Details
Closed on
Nov 28, 2022
Sold by
Miller Kandice Slater and Miller Alan Joseph
Bought by
Kandice Slater Miller Home Living Trust
Purchase Details
Closed on
Jun 14, 2012
Sold by
Slater David P and Slater Kandice J
Bought by
Slater Kandice J
Purchase Details
Closed on
Dec 20, 2010
Sold by
Larssen Todd R and Larssen Stefanie D
Bought by
Slater David P
Create a Home Valuation Report for This Property
The Home Valuation Report is an in-depth analysis detailing your home's value as well as a comparison with similar homes in the area
Home Values in the Area
Average Home Value in this Area
Purchase History
| Date | Buyer | Sale Price | Title Company |
|---|---|---|---|
| Kandice J Slater Living Trust | -- | None Listed On Document | |
| Miller Kandice Slater | -- | None Listed On Document | |
| Kandice Slater Miller Home Living Trust | -- | -- | |
| Slater Kandice J | -- | None Available | |
| Slater David P | $56,000 | None Available |
Source: Public Records
Tax History Compared to Growth
Tax History
| Year | Tax Paid | Tax Assessment Tax Assessment Total Assessment is a certain percentage of the fair market value that is determined by local assessors to be the total taxable value of land and additions on the property. | Land | Improvement |
|---|---|---|---|---|
| 2024 | $11,154 | $662,920 | $154,400 | $508,520 |
| 2023 | $11,476 | $650,030 | $154,400 | $495,630 |
| 2022 | $11,528 | $546,150 | $115,800 | $430,350 |
| 2021 | $11,528 | $546,150 | $115,800 | $430,350 |
| 2020 | $11,104 | $519,930 | $115,800 | $404,130 |
| 2019 | $11,474 | $519,930 | $115,800 | $404,130 |
| 2018 | $11,228 | $519,930 | $115,800 | $404,130 |
| 2017 | $2,892 | $519,930 | $115,800 | $404,130 |
| 2016 | $10,090 | $469,400 | $0 | $0 |
| 2015 | $10,090 | $499,410 | $0 | $0 |
| 2014 | $10,898 | $499,410 | $0 | $0 |
| 2013 | $10,706 | $0 | $0 | $0 |
| 2012 | -- | $550,700 | $147,080 | $403,620 |
Source: Public Records
Map
Nearby Homes
- 1840 Cromwell Cir
- 6155 Duggleby Ave
- 6121 Thor Ave
- 6115 Thor Ave
- 6109 Thor Ave
- 6112 Thor Ave
- 6103 Thor Ave
- 6108 Thor Ave
- 6107 Belle Ct
- 6107 Duggleby Ave
- 2006 E 59th Ct
- 5811 Duggleby Ave
- 6006 Lorton Ave
- 1811 Katie Ct
- 5809 Indigo Ave
- 5810 Indigo Ave
- 5805 Indigo Ave
- 5806 Indigo Ave
- 6319 College Ave
- 6315 College Ave
- 1839 Cromwell Cir
- 2239 Cromwell Cir
- 2229 Cromwell Cir
- 1830 Cromwell Cir
- 1820 Cromwell Cir
- 2255 Cromwell Cir
- 1720 Cromwell Cir
- 2209 Cromwell Cir
- 1929 Cromwell Cir
- 1920 Cromwell Cir
- 2159 Cromwell Cir
- 6156 Thor Ave
- 2214 Parkview Ln
- 2220 Parkview Ln
- 2261 Cromwell Cir
- 2236 Cromwell Cir
- 1959 Cromwell Cir
- 2139 Cromwell Cir
- 6171 Belle Ct
- 6150 Thor Ave