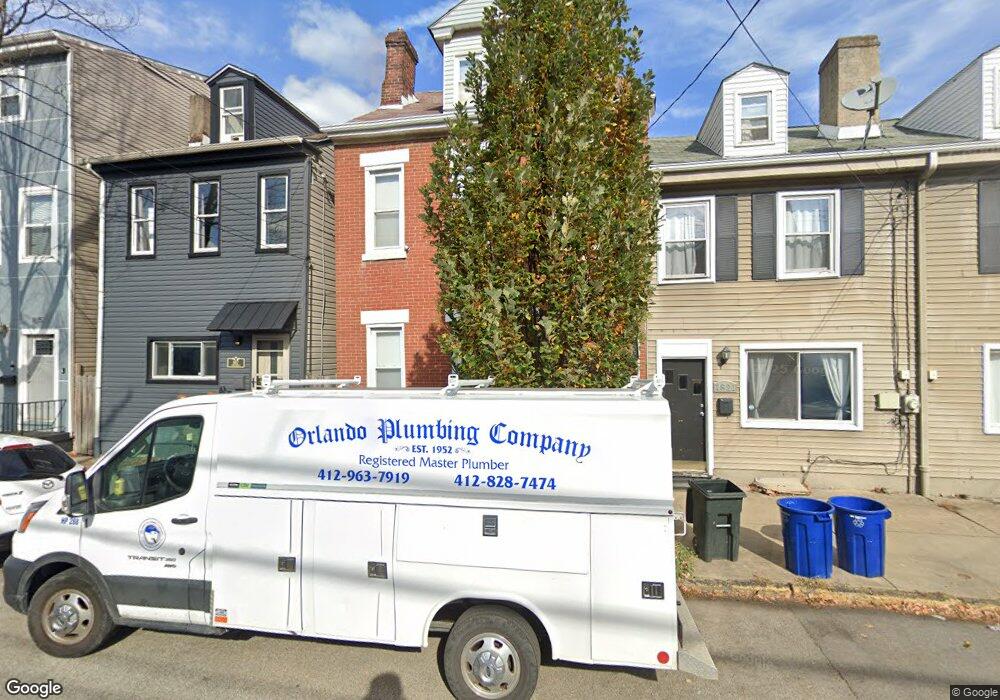
1819 Jane St Pittsburgh, PA 15203
Southside Flats NeighborhoodEstimated Value: $270,403 - $325,000
2
Beds
1
Bath
1,744
Sq Ft
$168/Sq Ft
Est. Value
About This Home
This home is located at 1819 Jane St, Pittsburgh, PA 15203 and is currently estimated at $292,601, approximately $167 per square foot. 1819 Jane St is a home located in Allegheny County with nearby schools including Pittsburgh Phillips K-5 Elementary School, South Hills Middle School, and Pittsburgh Brashear High School.
Ownership History
Date
Name
Owned For
Owner Type
Purchase Details
Closed on
Sep 15, 2004
Sold by
Severyn Donald A
Bought by
Edgos Lenna J
Current Estimated Value
Home Financials for this Owner
Home Financials are based on the most recent Mortgage that was taken out on this home.
Original Mortgage
$150,000
Outstanding Balance
$75,007
Interest Rate
6.02%
Mortgage Type
New Conventional
Estimated Equity
$217,594
Purchase Details
Closed on
Mar 1, 1999
Sold by
Maloney Ii Thomas Joyce
Bought by
Severyn Donald A and Lewis Joshua C
Purchase Details
Closed on
Jan 1, 1900
Create a Home Valuation Report for This Property
The Home Valuation Report is an in-depth analysis detailing your home's value as well as a comparison with similar homes in the area
Home Values in the Area
Average Home Value in this Area
Purchase History
| Date | Buyer | Sale Price | Title Company |
|---|---|---|---|
| Edgos Lenna J | $187,000 | -- | |
| Severyn Donald A | $99,000 | -- | |
| -- | -- | -- |
Source: Public Records
Mortgage History
| Date | Status | Borrower | Loan Amount |
|---|---|---|---|
| Open | Edgos Lenna J | $150,000 |
Source: Public Records
Tax History Compared to Growth
Tax History
| Year | Tax Paid | Tax Assessment Tax Assessment Total Assessment is a certain percentage of the fair market value that is determined by local assessors to be the total taxable value of land and additions on the property. | Land | Improvement |
|---|---|---|---|---|
| 2025 | $3,622 | $157,200 | $86,800 | $70,400 |
| 2024 | $3,622 | $157,200 | $86,800 | $70,400 |
| 2023 | $3,622 | $157,200 | $86,800 | $70,400 |
| 2022 | $3,575 | $157,200 | $86,800 | $70,400 |
| 2021 | $3,165 | $139,200 | $86,800 | $52,400 |
| 2020 | $3,150 | $139,200 | $86,800 | $52,400 |
| 2019 | $3,150 | $139,200 | $86,800 | $52,400 |
| 2018 | $3,150 | $139,200 | $86,800 | $52,400 |
| 2017 | $3,150 | $139,200 | $86,800 | $52,400 |
| 2016 | $658 | $139,200 | $86,800 | $52,400 |
| 2015 | $658 | $139,200 | $86,800 | $52,400 |
| 2014 | $3,081 | $139,200 | $86,800 | $52,400 |
Source: Public Records
Map
Nearby Homes